

Question: I need help me with the math questions ASAP, it's very important and these are a practice questions. Please I need help with it as
I need help me with the math questions ASAP, it's very important and these are a practice questions.
Please I need help with it as fast as you can, I don't want this to take long I need it within an hour.
Note: I need the working out very clear.
![Selling Price ($) [1] ii) Continent of manufacture iii) Battery Capacity (KWh)](https://dsd5zvtm8ll6.cloudfront.net/si.experts.images/questions/2024/10/671c3f4ad15e4_458671c3f4aa665d.jpg)
 What](https://dsd5zvtm8ll6.cloudfront.net/si.experts.images/questions/2024/10/671c3f4c38030_459671c3f4c0255f.jpg)
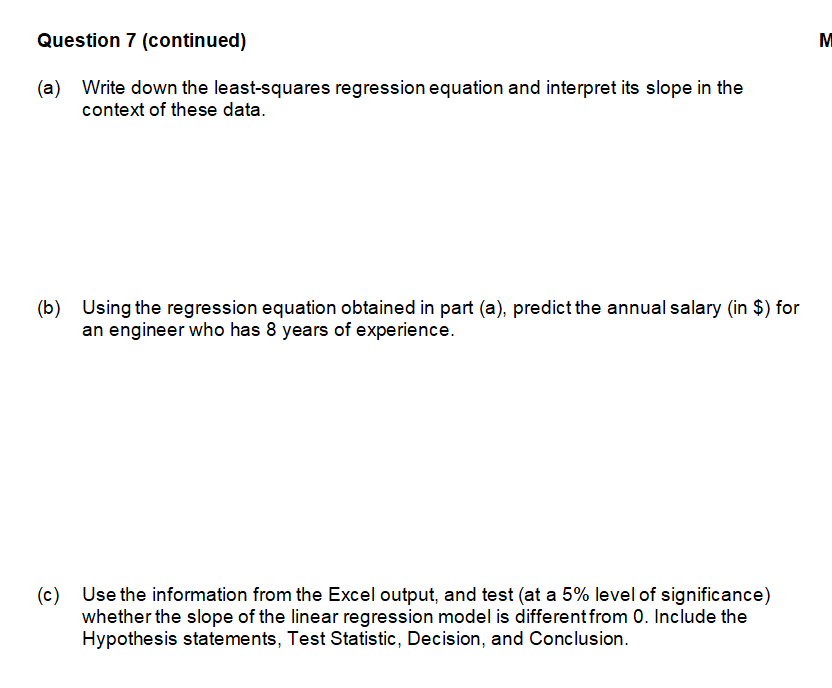
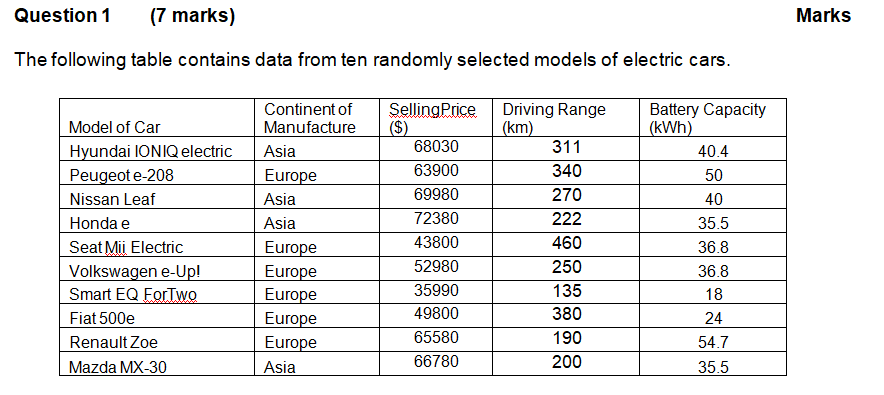
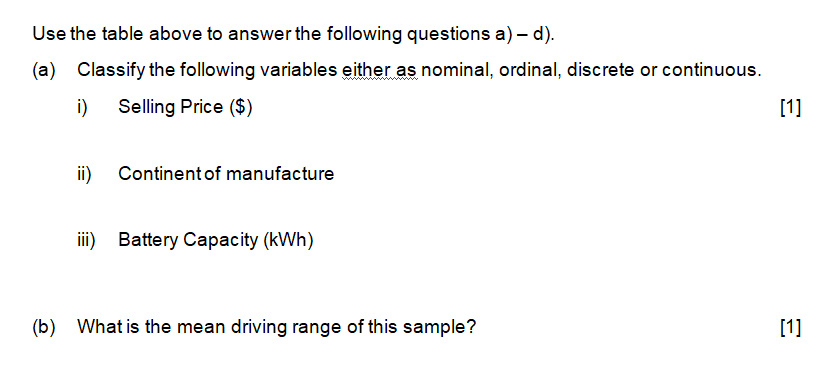
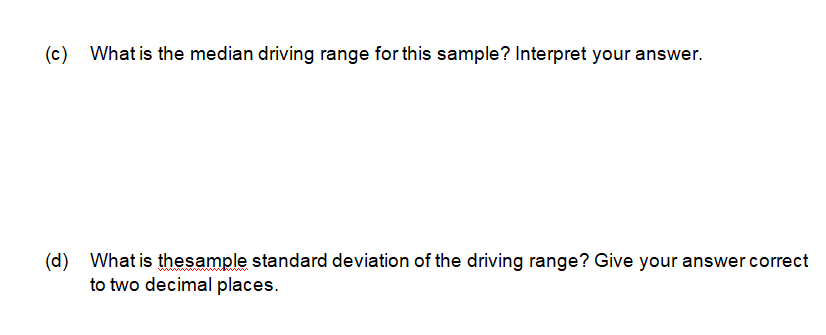
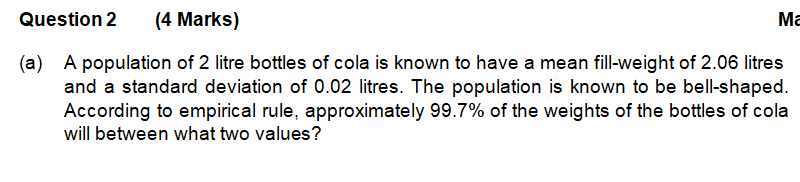
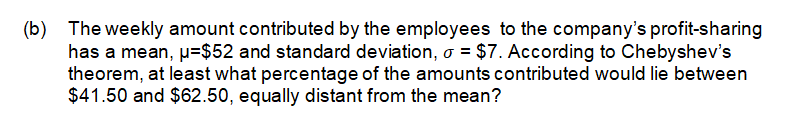
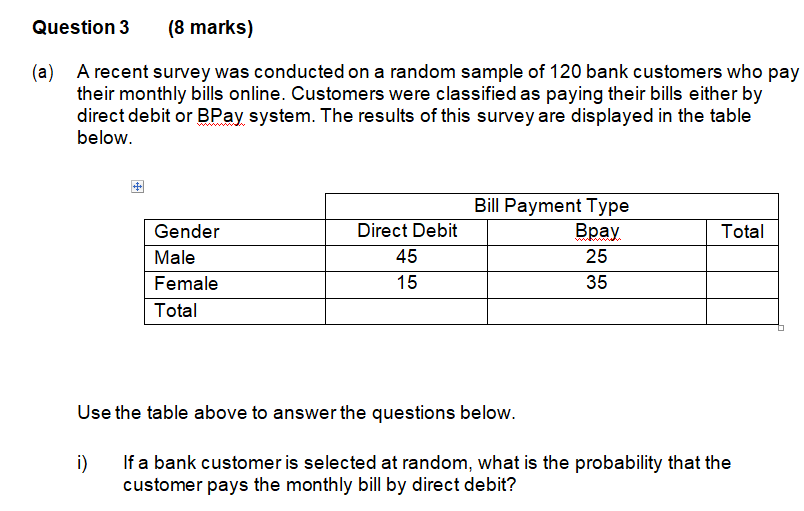
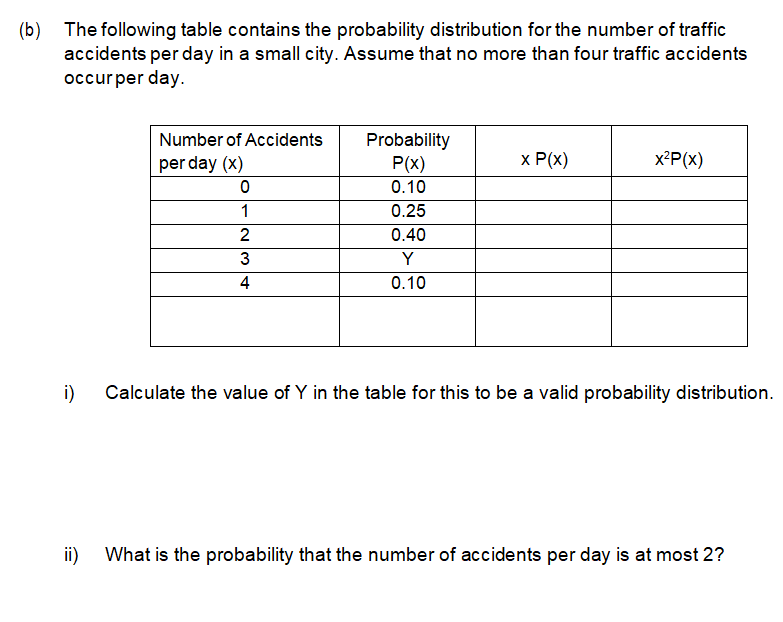
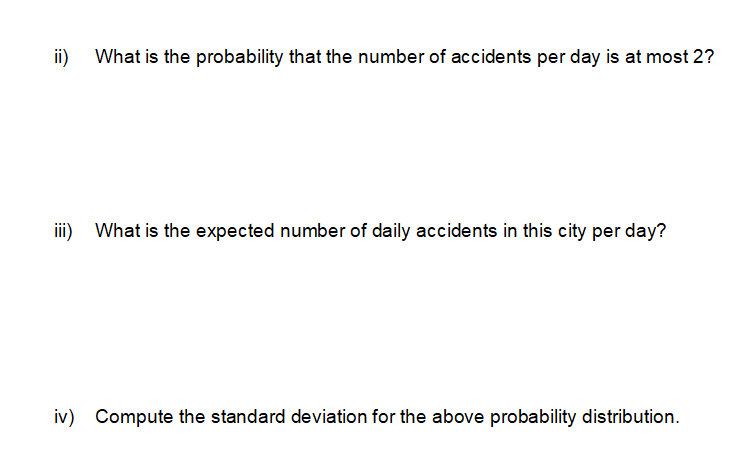
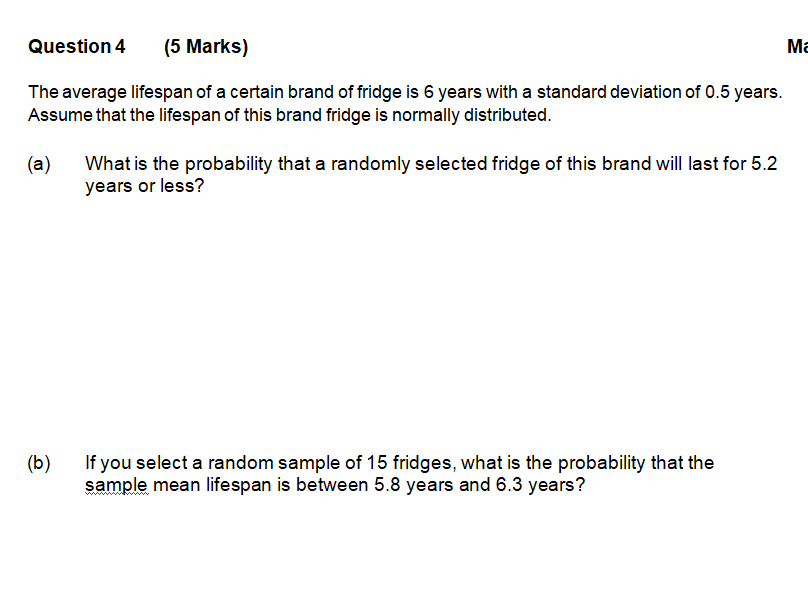
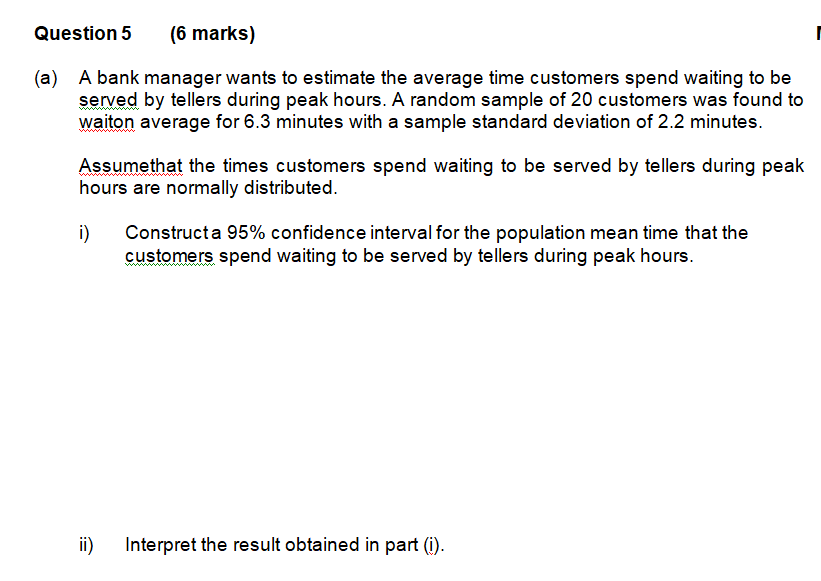
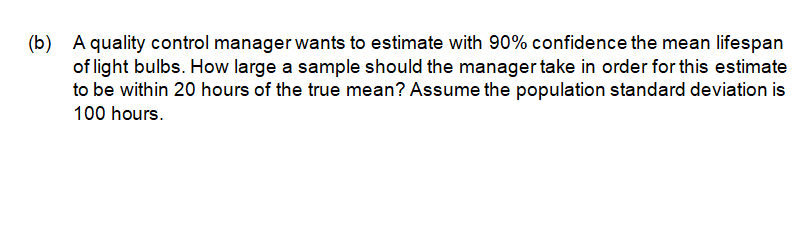
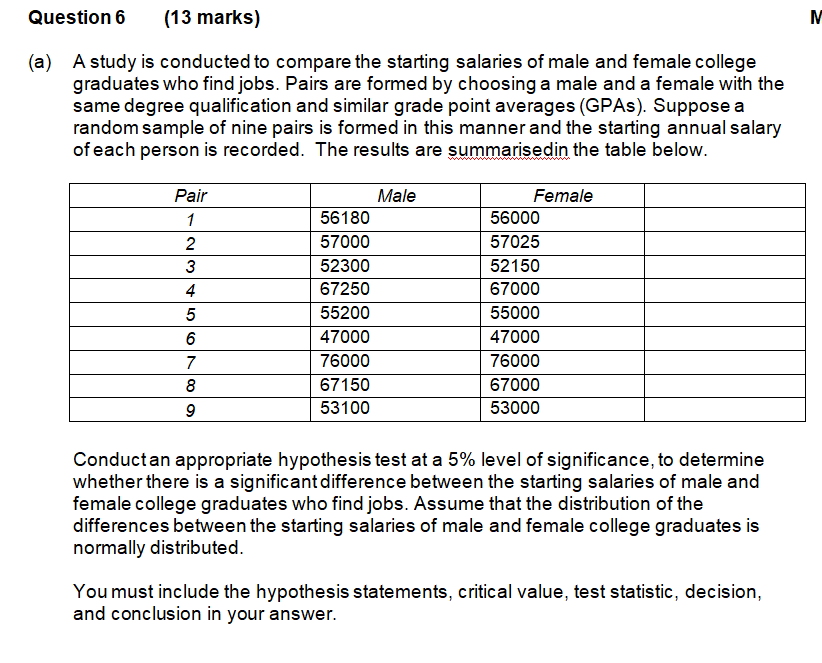
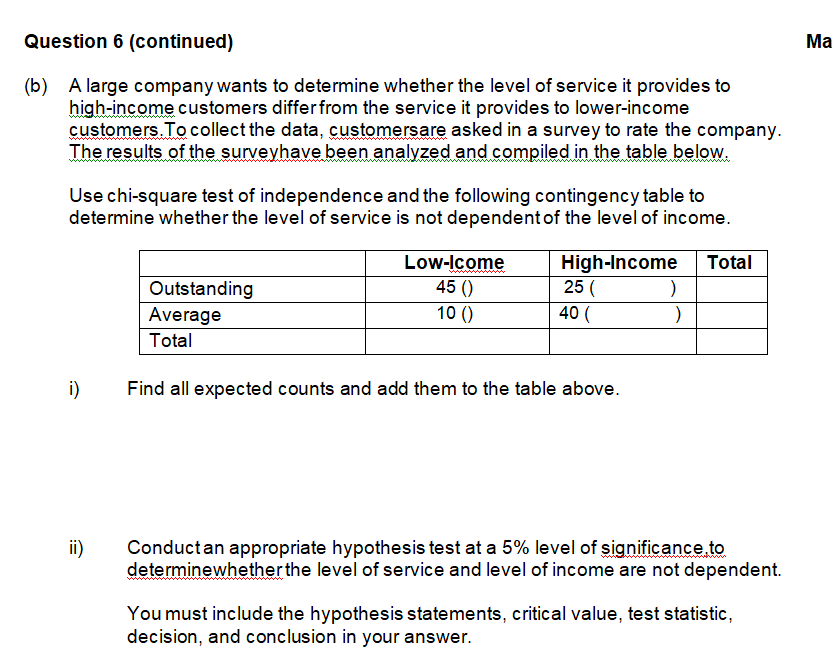
Question 1 (7 marks) Marks The following table contains data from ten randomly selected models of electric cars. Continent of Selling Price. Driving Range Battery Capacity Model of Car Manufacture ($ (km) (KWh) Hyundai IONIQ electric Asia 68030 311 40.4 Peugeot e-208 Europe 63900 340 50 Nissan Leaf Asia 69980 270 40 Honda e Asia 72380 222 35.5 Seat Mii Electric Europe 43800 460 36.8 Volkswagen e-Up! Europe 52980 250 36.8 Smart EQ ForTwo Europe 35990 135 18 Fiat 500e Europe 49800 380 24 Renault Zoe Europe 65580 190 54.7 Mazda MX-30 Asia 66780 200 35.5Use the table above to answer the following questions a) - d). (a) Classify the following variables either as nominal, ordinal, discrete or continuous. i) Selling Price ($) [1] ii) Continent of manufacture iii) Battery Capacity (KWh) (b) What is the mean driving range of this sample? [1](c) What is the median driving range for this sample? Interpret your answer. (d) What is thesample standard deviation of the driving range? Give your answer correct to two decimal places.Question 2 (4 Marks) Ma (a) A population of 2 litre bottles of cola is known to have a mean fill-weight of 2.06 litres and a standard deviation of 0.02 litres. The population is known to be bell-shaped. According to empirical rule, approximately 99.7% of the weights of the bottles of cola will between what two values?(b) The weekly amount contributed by the employees to the company's profit-sharing has a mean, u=%$52 and standard deviation, = $7. According to Chebyshev's theorem, at least what percentage of the amounts contributed would lie between $41.50 and $62.50, equally distant from the mean? Question 3 (8 marks) (a) A recent survey was conducted on a random sample of 120 bank customers who pay their monthly bills online. Customers were classified as paying their bills either by direct debit or BPay system. The results of this survey are displayed in the table below. Bill Payment Type Gender Direct Debit Bpay Total Male 45 25 Female 15 35 Total Use the table above to answer the questions below. If a bank customer is selected at random, what is the probability that the customer pays the monthly bill by direct debit?ii) If a bank customer is randomly selected, what is the probability that the customer is female, or the customer pays the monthly bill using BPay method?(b) The following table contains the probability distribution for the number of traffic accidents per day in a small city. Assume that no more than four traffic accidents occurper day. Number of Accidents Probability per day (x) P(x) X P(x) x2P(x) 0 0.10 0.25 2 0.40 Y 4 0.10 i) Calculate the value of Y in the table for this to be a valid probability distribution. ii) What is the probability that the number of accidents per day is at most 2?i) Whatis the probability that the number of accidents per day is at most 27 i) What is the expected number of daily accidents in this city per day? iv) Compute the standard deviation for the above probability distribution. Question 4 (5 Marks) Ma The average lifespan of a certain brand of fridge is 6 years with a standard deviation of 0.5 years. Assume that the lifespan of this brand fridge is normally distributed. (a) What is the probability that a randomly selected fridge of this brand will last for 5.2 years or less? (b) If you select a random sample of 15 fridges, what is the probability that the sample mean lifespan is between 5.8 years and 6.3 years?Question 5 (6 marks) (a) A bank manager wants to estimate the average time customers spend waiting to be served by tellers during peak hours. A random sample of 20 customers was found to waiton average for 6.3 minutes with a sample standard deviation of 2.2 minutes. Assumethat the times customers spend waiting to be served by tellers during peak hours are normally distributed. i) Constructa 95% confidence interval for the population mean time that the customers spend waiting to be served by tellers during peak hours. i) Interpret the result obtained in part (i). (b) A quality control manager wants to estimate with 90% confidence the mean lifespan of light bulbs. How large a sample should the managertake in order for this estimate to be within 20 hours of the true mean? Assume the population standard deviation is 100 hours. Question 6 (13 marks) (a) A study is conducted to compare the starting salaries of male and female college graduates who find jobs. Pairs are formed by choosing a male and a female with the same degree qualification and similar grade point averages (GPAs). Suppose a random sample of nine pairs is formed in this manner and the starting annual salary of each person is recorded. The results are summarisedin the table below. Pair Male Female 1 56180 56000 57000 57025 3 52300 52150 4 67250 67000 55200 55000 47000 47000 76000 76000 67150 67000 9 53100 53000 Conductan appropriate hypothesis test at a 5% level of significance, to determine whether there is a significant difference between the starting salaries of male and female college graduates who find jobs. Assume that the distribution of the differences between the starting salaries of male and female college graduates is normally distributed. You must include the hypothesis statements, critical value, test statistic, decision, and conclusion in your answer.Question 6 (continued) Ma (b) Alarge company wants to determine whether the level of service it provides to high-income customers differfrom the service it provides to lower-income customers.To collectthe data, customersare asked in a survey to rate the company. The results of the surveyhave been analyzed and compiled in the table below. Use chi-square test of independence and the following contingency table to determine whether the level of service is not dependentof the level of income. Low-lcome Qutstanding 45 () Average 10 () Total i) Find all expected counts and add them to the table above. i) Conductan appropriate hypothesis test at a 5% level of significance. to determinewhetherthe level of service and level of income are not dependent. You must include the hypothesis statements, critical value, test statistic, decision, and conclusion in your answer. Question 7 (7 marks) Marks A researcher is interested in determining whether a linear relationship exists between the years of experience and annual salary for engineers. The Microsoft Excel output analysis of these data fortwenty-three randomly selected engineers is displayed below. Use these results to answer the questions on the next page. Scatterplot of Salary versus Experience 140 130 120 110 Salary ($ 000) 3 5 7 9 11 13 Experience (Years)Regression Statistics Multiple R 0.902165802 R Square 0.813903134 Adjusted R Square 0.805041378 Standard Error 9.574115488 Observations 23 Coefficients Standard Error t Stat P-value Intercept 49.77532122 5.169886 9.627933 3.75E-09 Experience (Years) 6.695335108 0.698628 9.583551 4.06E-09Question 7 (continued) M (a) Write down the least-squares regression equation and interpret its slope in the context of these data. (b) Using the regression equation obtained in part (a), predict the annual salary (in $) for an engineer who has 8 years of experience. (c) Use the information from the Excel output, and test (at a 5% level of significance) whether the slope of the linear regression model is differentfrom 0. Include the Hypothesis statements, Test Statistic, Decision, and Conclusion
Step by Step Solution
There are 3 Steps involved in it

Get step-by-step solutions from verified subject matter experts