

Question: i need help on finding need help on finding the rations 1-5. Compute the financial ratios based on financial statements of Intel (Exhibits 38.2 and
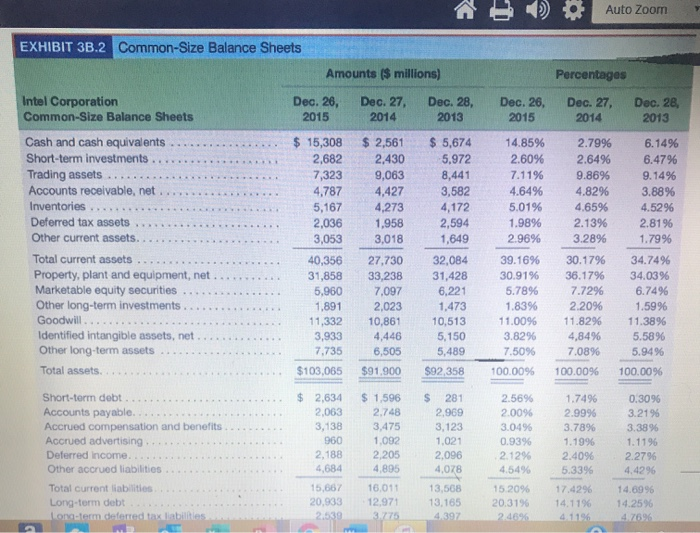
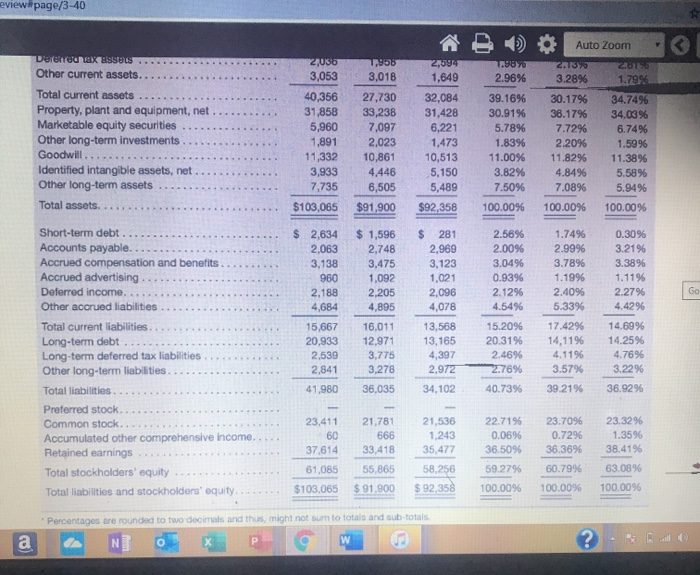
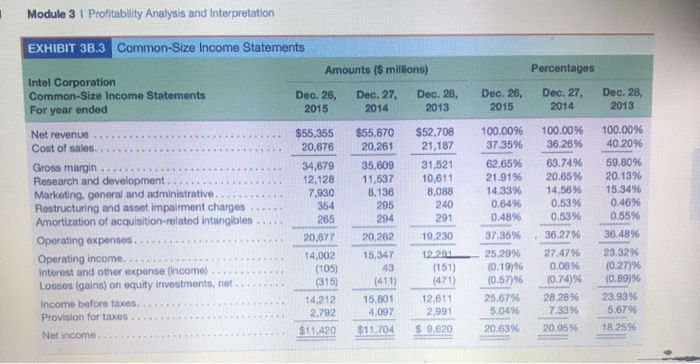
Compute the financial ratios based on financial statements of Intel (Exhibits 38.2 and 33.3 on pp. 3-40 and 3.41. 1) Profit Margin 2) Total Asset Turnover 3) Return on Assets 4) Financial Leverage 5) Return on Equity ) Auto Zoom Percentages Dec. 26, 2015 Dec. 27, 2014 Dec. 28, 2013 EXHIBIT 3B.2 Common-Size Balance Sheets Amounts ($ millions) Intel Corporation Dec. 26, Dec. 27, Dec. 28, Common-Size Balance Sheets 2015 2014 2013 Cash and cash equivalents $ 15,308 $ 2,561 $ 5,674 Short-term investments .. 2,682 2,430 5.972 Trading assets ....... 7,323 9,063 8,441 Accounts receivable, net. 4,787 4,427 3,582 Inventories. 5,167 4,273 4,172 Deferred tax assets 2,036 1,958 2,594 Other current assets.... 3,053 3,018 1,649 Total current assets ...... 40,356 27,730 32,084 Property, plant and equipment, net. 31,858 33,238 31,428 Marketable equity securities .. 5,960 7,097 6,221 Other long-term investments .. 1,891 2,023 1,473 Goodwill......... .. 11,332 10,861 10,513 Identified intangible assets, net. 3,933 4,446 5,150 Other long-term assets 7,735 6,505 5,489 Total assets.... $103,065 $91.900 $92,358 14.85% 2.60% 7.11% 4.64% 5.01% 1.98% 2.96% 2.79% 2.64% 9.86% 4.82% 4,65% 2.13% 3.28% 6.14% 6.47% 9.14% 3.88% 4.52% 2.8196 1.79% 34.74% 34.03% 6.74% 1.59% 11.38% 5.5896 5.94% 39.16% 30.91% 5.78% 1.83% 11.00% 3.82% 7.50% 30.1796 36.17% 7.72% 2.20% 11.82% 4,84% 7.08% 100.00% 100.00% 100.0096 $ $ Short-term debt Accounts payable....... Accrued compensation and benefits Accrued advertising Deferred Income. Other accrued liabilities..... Total current liabilities Long-term debt. Long term deferred tax abilities 2,634 2,063 3,138 960 2,188 4,684 15,667 20.933 2.539 $ 1,596 2.748 3.475 1.092 2,205 4,895 16.011 12.971 3.775 281 2.969 3,123 1,021 2,096 4,078 2.56% 2.00% 3.04% 0.93% 2.12% 4.54% 1.74% 2.99% 3.78% 1.19% 2.40% 5.33% 0.3096 3.21% 3.38% 1.1196 2.2796 4.4296 13,568 13,165 4397 15 20% 20.3196 2.46% 17.42% 14.11% 4.11% 14.6996 14.25% 4.76% - eview#page/3-40 Dereceu ax assets..... Other current assets........ Total current assets ........ Property, plant and equipment, net. Marketable equity securities ... Other long-term investments .... Goodwill......... Identified intangible assets, net Other long-term assets.. Total assets... 2 UGIRLS 3,053 3,018 40,356 27,730 31,858 33,238 5,960 7,097 1,891 11,332 10,861 3,933 4.446 7,735 6,505 $103,065 $91,900 M S ) * Auto Zoom 2,094887313328613 1,649 2.96% 3.28% 1.79% 32,084 39.16% 30.17% 34.74% 31,428 30.91% 36.17% 34.03% 6,221 5.78% 7.72% 6.74% 1,473 1.83% 2.20% 1.59% 10,513 11.00% 11.82% 11.38% 5,150 3.82% 4.84% 5.58% 5,489 7.50% 7.08% 5.94% $92,358 100.00% 100.00% 100.00% 2,023 $ 2,634 2,063 3,138 960 2,188 4,684 $ 1,596 2,748 3,475 1.092 2,205 4,895 281 2,969 3,123 1,021 2,096 4,078 2.56% 2.00% 3.04% 0.93% 2.12% 4.54% Short-term debt.. Accounts payable... Accrued compensation and benefits Accrued advertising Deferred income...... Other accrued liabilities.... Total current liabilities. Long-term debt ... Long-term deferred tax liabilities Other long-term liabilities... Total liabilities....... Preferred stock. ..... Common stock. ..... Accumulated other comprehensive income... Retained earnings Total stockholders' equity.. Total liabilities and stockholders' equity 1.74% 2.99% 3.78% 1.19% 2.40% 5.33% 17.4296 14,11% 4.11% 3.57% 39 21% 0.30% 3.21% 3.38% 1.11% 2.27% 4.42% 14.69% 14.25% 4.7696 3.22% 36.9296 15,667 20,933 2,539 2,841 41.980 16.011 12,971 3.775 3.278 36,035 13,568 13,165 4,397 2,972 34,102 15.20% 20.31% 2.4696 2276% 40.73% 23,411 60 37.614 21.781 666 33,418 55,865 $ 91.900 21,536 1.243 35,477 58.256 $ 92,358 22.7195 0.06% 36.50% 59.27% 100.00% 23.70% 0.7296 36.36% 60.79% 100.00% 23.32% 1.35% 38.41% 63.08% 100.00% 61,085 $103.065 Percentages are rounded to two doolmats and thus, might not sum to totals and sub-totals a Nox Powm ? . Module 3 Profitability Analysis and Interpretation EXHIBIT 3B.3 Common-Size Income Statements Amounts ($ millions) Intel Corporation Common-Size Income Statements Dec. 26, Dec. 27, Dec. 28, For year ended 2015 2014 2013 Dec. 26, 2015 Percentages Dec. 27, 2014 Dec. 28, 2013 $55,355 20,676 Net revenue .. Cost of sales...... Gross margin ...... Research and development...... Marketing, general and administrative... Restructuring and asset impairment charges. Amortization of acquisition-related intangibles... Operating expenses... . Operating income...... .... Interest and other expense (income). Losses (gains) on equity investments, net Income before taxes...... Provision for taxes... . Net income $52.708 21.187 31,521 10.611 8,088 240 291 $55,870 20,261 35,609 11.537 8.136 295 294 20.262 34,679 12,128 7,930 354 265 20.577 14,002 (105) 315 14.212 2.792 100.00% 37.35% 62.6596 21.9196 14.33% 0.64% 0.48% 37.35% 25.29% (0.19% (0.57)% 25.67% 5.0496 20.63% 100.00% 36.26% 63.74% 20.65% 14.56% 0.53% 0.53% 36.27% 27.47% 100.00% 40.20% 59.80% 20.13% 15.34% 0.46% 0.55% 36.48% 23.32% (0.27% (0.8996 23.9396 5.6766 19.230 . 15,347 (151) 1471 (411) 15,801 4,097 $11.704 12,611 2.991 (0.74% 28.28% 7.33% 20.95% $11.420 S 9,620 18 2596
Step by Step Solution
There are 3 Steps involved in it

Get step-by-step solutions from verified subject matter experts