

Question: I need help on solving the hart and graph queastions. 55 64 66 67 68 71 74 77 75 78 79 75 77 80 80
I need help on solving the hart and graph queastions.
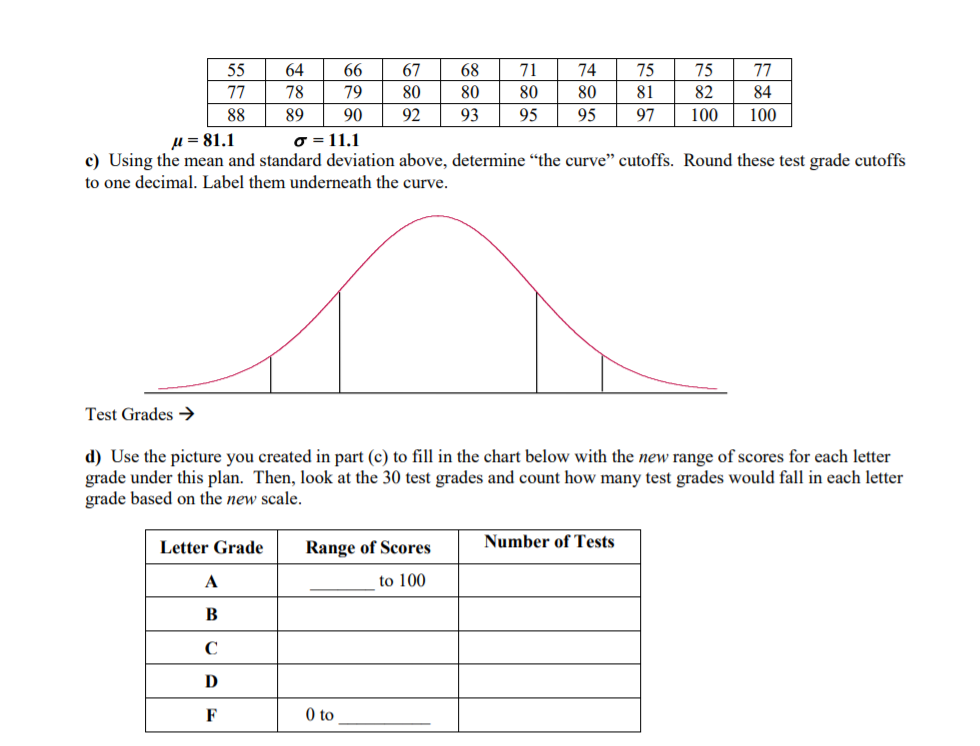
55 64 66 67 68 71 74 77 75 78 79 75 77 80 80 80 80 81 88 82 84 89 90 92 93 95 95 97 100 u = 81.1 100 0 = 11.1 c) Using the mean and standard deviation above, determine "the curve" cutoffs. Round these test grade cutoffs to one decimal. Label them underneath the curve. Test Grades d) Use the picture you created in part (c) to fill in the chart below with the new range of scores for each letter grade under this plan. Then, look at the 30 test grades and count how many test grades would fall in each letter grade based on the new scale. Letter Grade Range of Scores Number of Tests A to 100 B C D F 0 to
Step by Step Solution
There are 3 Steps involved in it

Get step-by-step solutions from verified subject matter experts