

Question: I need help on this mathlab question. anyone please; Q1. Create a GUI using Matlab to generate and plot a vector of random values (You
I need help on this mathlab question. anyone please;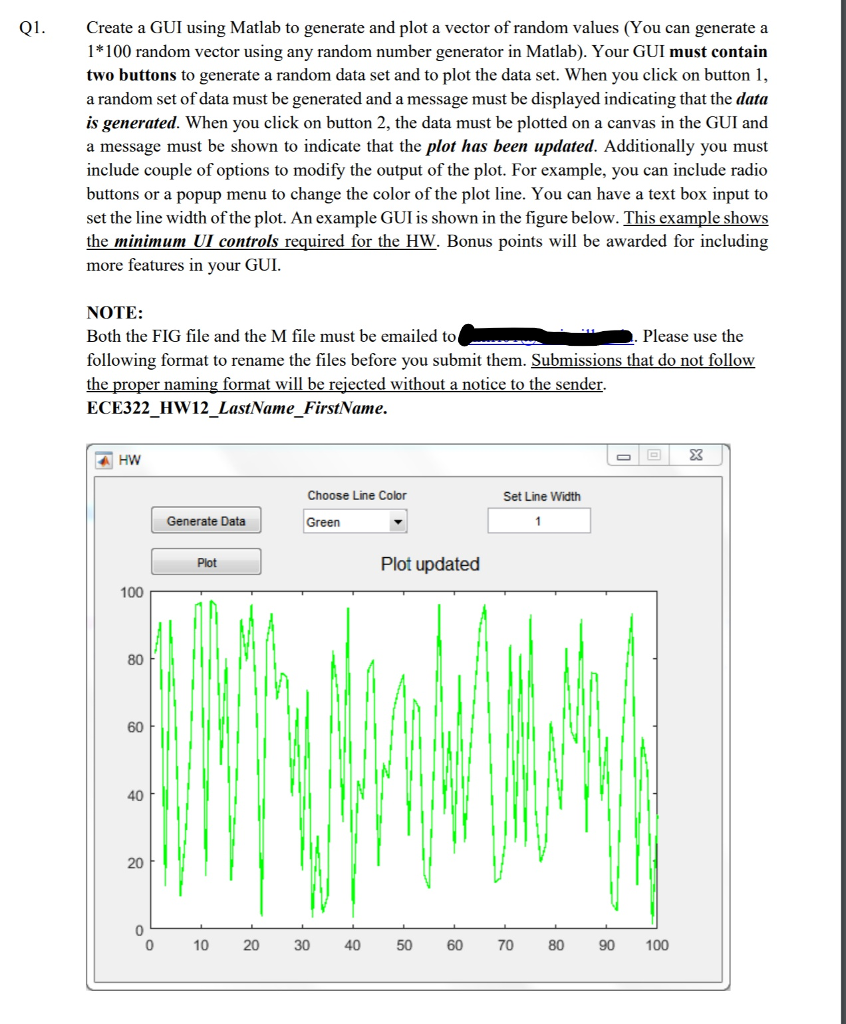
Q1. Create a GUI using Matlab to generate and plot a vector of random values (You can generate a 1*100 random vector using any random number generator in Matlab). Your GUI must contain two buttons to generate a random data set and to plot the data set. When you click on button 1, a random set of data must be generated and a message must be displayed indicating that the data is generated. When you click on button 2, the data must be plotted on a canvas in the GUI and a message must be shown to indicate that the plot has been updated. Additionally you must include couple of options to modify the output of the plot. For example, you can include radio buttons or a popup menu to change the color of the plot line. You can have a text box input to set the line width of the plot. An example GUI is shown in the figure below. This example shows the minimum UI controls required for the HW. Bonus points will be awarded for including more features in your GUI NOTE: Both the FIG file and the M file must be emailed to following format to rename the files before you submit them. Submissions that do not follow Please use the naming format will be reiected without a notice to the sender ECE322 HW12LastNameFirstName. Choose Line Color Set Line Width Generate Data Green Plot Plot updated 100 80 60 40 20 0 0 10 20 30 40 50 60 70 80 90 100
Step by Step Solution
There are 3 Steps involved in it

Get step-by-step solutions from verified subject matter experts