

Question: I need help on this MATLAB question. 20 24 680 Exercise 1: (electrical engineering - signal processing) Consider the function defined by the graph above.
I need help on this MATLAB question.
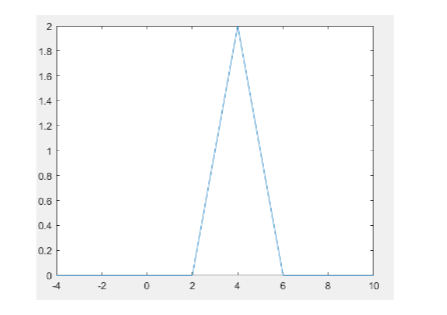
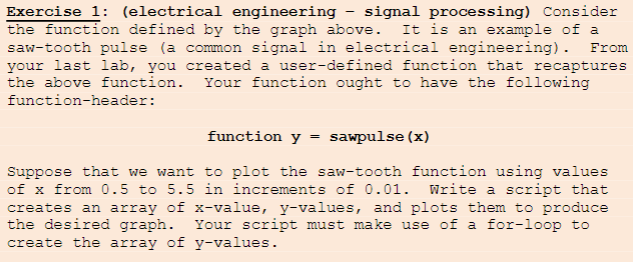
20 24 680 Exercise 1: (electrical engineering - signal processing) Consider the function defined by the graph above. It is an example of a saw-tooth pulse (a common signal in electrical engineering). From your last lab, you created a user-defined function that recaptures the above function. Your function ought to have the following function-header: function y = sawpulse (x) Suppose that we want to plot the saw-tooth function using values of x from 0.5 to 5.5 in increments of 0.01. Write a script that creates an array of x-value, y-values, and plots them to produce the desired graph. Your script must make use of a for-loop to create the array of y-values
Step by Step Solution
There are 3 Steps involved in it

Get step-by-step solutions from verified subject matter experts