

Question: i need help on this question Suppose the three points in the graph below illustrate a rm's expansion path: the costminimizing input bundles at three
i need help on this question
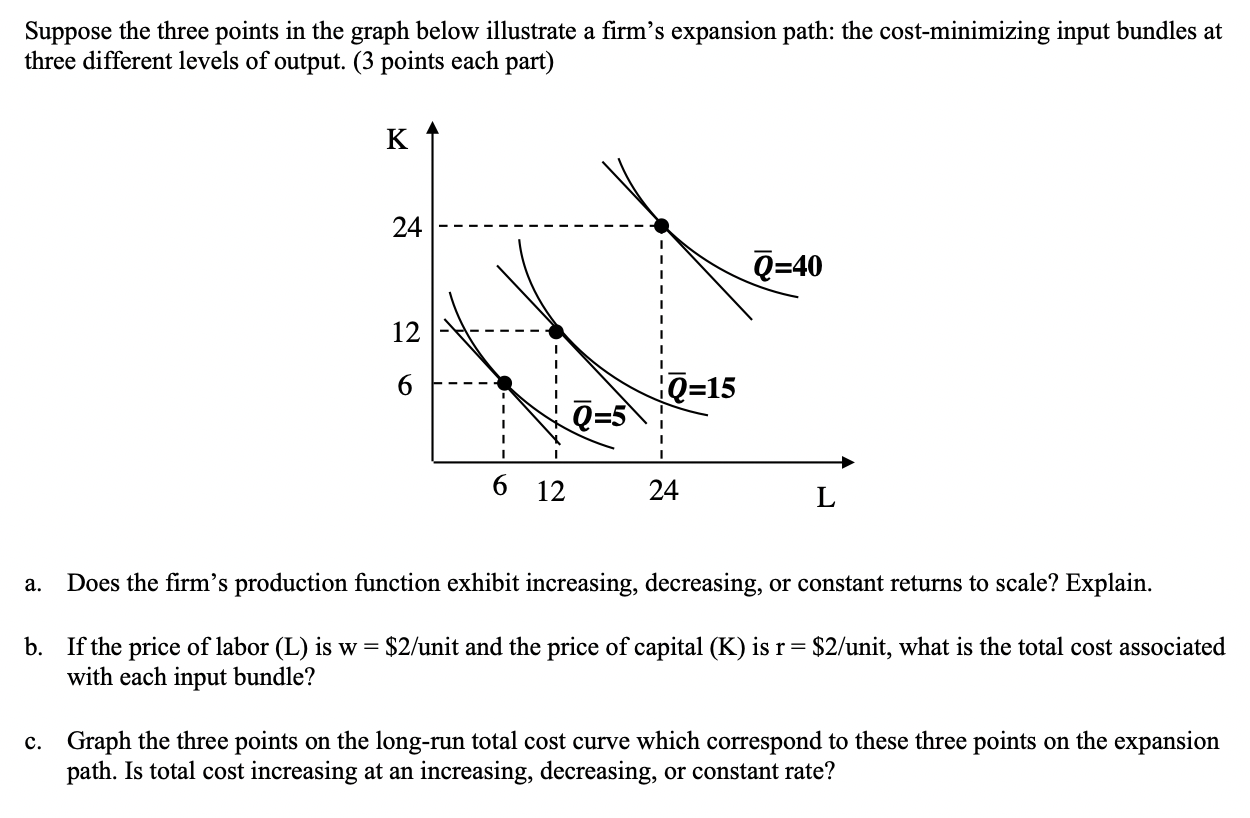
Suppose the three points in the graph below illustrate a rm's expansion path: the costminimizing input bundles at three different levels of output. (3 points each part) a. Does the rm's production Jnction exhibit increasing, decreasing, or constant returns to scale? Explain. b. If the price of labor (L) is w = $2/unit and the price of capital (K) is r = $2/unit, what is the total cost associated with each input bundle? c. Graph the three points on the long-run total cost curve which correspond to these three points on the expansion path. Is total cost increasing at an increasing, decreasing, or constant rate
Step by Step Solution
There are 3 Steps involved in it

Get step-by-step solutions from verified subject matter experts