

Question: I need help on this spss homework question please. 2. The following output is a crosstab of R's Health (HEALTH Reverse Coded) and frequency of
I need help on this spss homework question please.
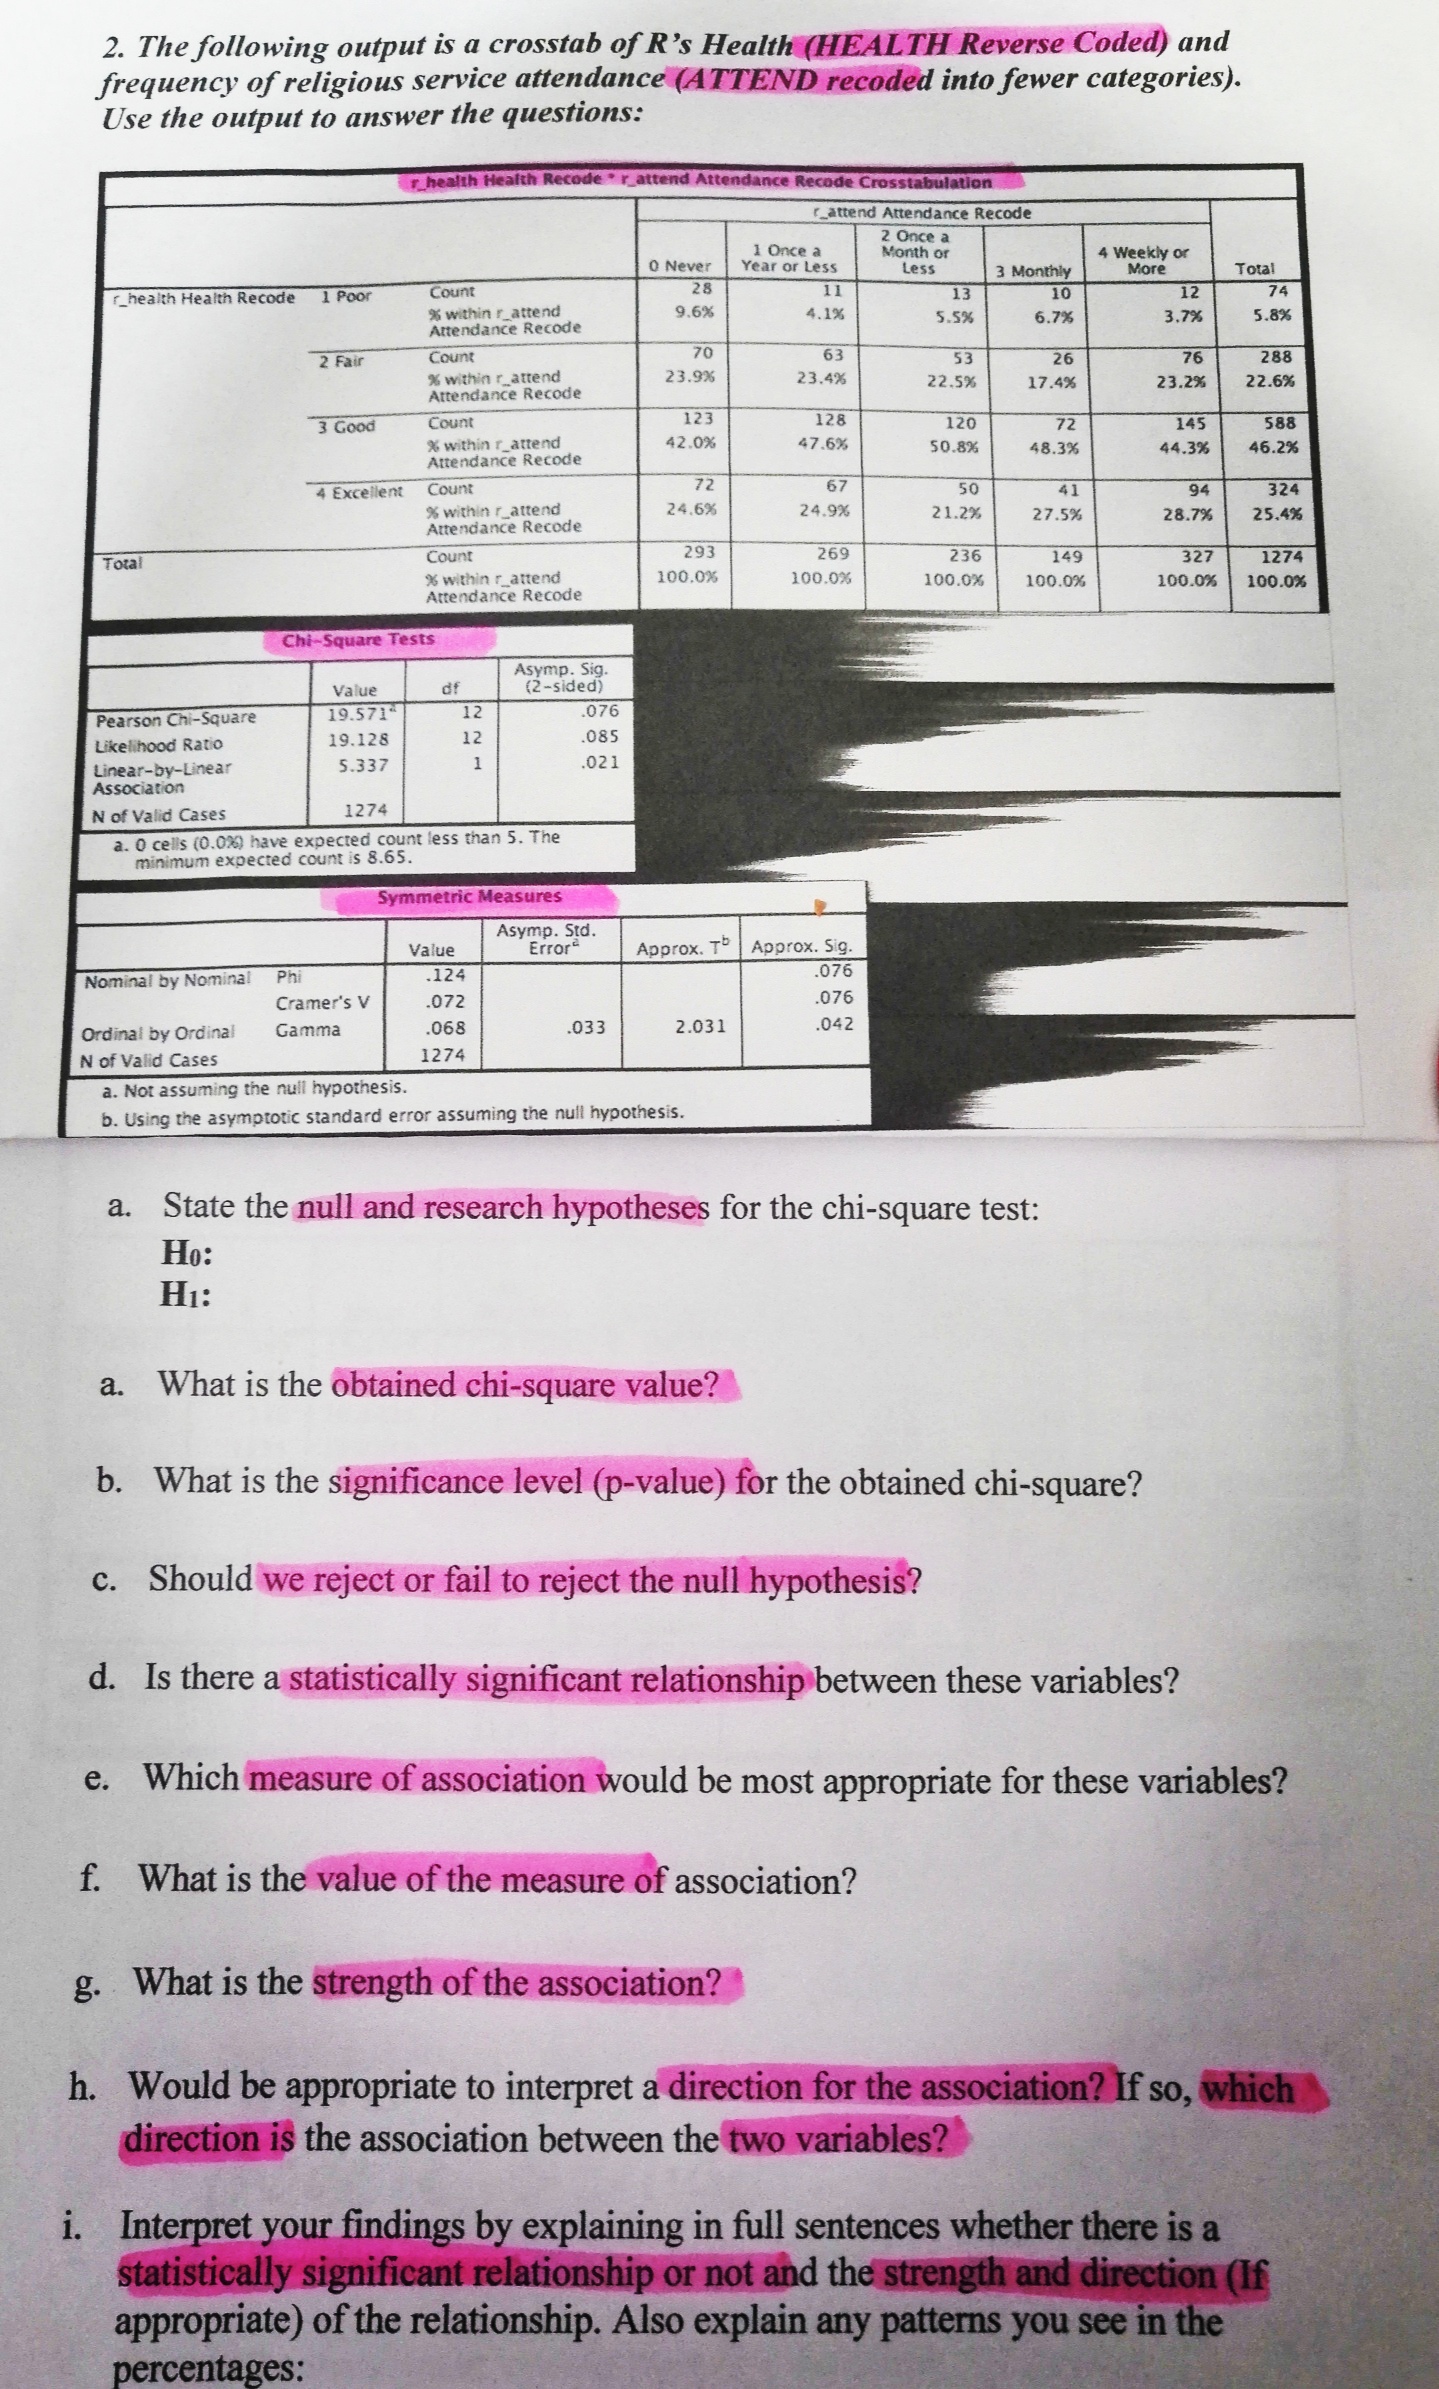
2. The following output is a crosstab of R's Health (HEALTH Reverse Coded) and frequency of religious service attendance (ATTEND recoded into fewer categories). Use the output to answer the questions: health Health Recode . r_attend Attendance Recode _attend Attendance Recode 2 Once a 0 Never 1 Once a Month or Year or Less 4 Weekly or Less 3 Monthly More Total r_health Health Recode 1 Poor Count 28 11 * within r_attend 13 10 12 74 9.6% 4.1%% Attendance Recode 5.5% 6.7% 3.7% 5.8% 2 Fair Count 70 63 53 26 % within r_attend 23.92 76 288 23.4% Attendance Recode 22.5% 17.4% 23.29 22.6%% 3 Good Count 123 128 120 588 * within r_attend 145 42.0% 7.6% Attendance Recode 50.8% 48.3% 44.3% 46.2% 4 Excellent Count 72 67 50 94 % within r_attend 24.6 324 24.9% Attendance Recode 21.2% 27.5% 28.7% 25.4% Total Count 293 269 236 149 327 % within r_attend 100.0% 1274 100.0% Attendance Recode 100.0% 100.0%% 100.0% 100.0% Chi-Square Tests Asymp. Sig. Value of (2-sided) Pearson Chi-Square 19.571 12 076 Likelihood Ratio 19.128 12 .085 Linear-by-Linear 5.337 .021 Association N of Valid Cases 1274 a. 0 cells (0.0%) have expected count less than 5. The minimum expected count is 8.65. Symmetric Measures Asymp. Std Value Error Approx. To Approx. Sig. Nominal by Nominal Phi .124 076 Cramer's V 072 .076 Ordinal by Ordinal Gamma .068 .033 2.031 .042 N of Valid Cases 1274 a. Not assuming the null hypothesis. b. Using the asymptotic standard error assuming the null hypothesis. a. State the null and research hypotheses for the chi-square test: Ho: HI: a. What is the obtained chi-square value? b. What is the significance level (p-value) for the obtained chi-square? c. Should we reject or fail to reject the null hypothesis? d. Is there a statistically significant relationship between these variables? e. Which measure of association would be most appropriate for these variables? f. What is the value of the measure of association? g. What is the strength of the association? h. Would be appropriate to interpret a direction for the association? If so, which direction is the association between the two variables? i. Interpret your findings by explaining in full sentences whether there is a statistically significant relationship or not and the strength and direction (If appropriate) of the relationship. Also explain any patterns you see in the percentages
Step by Step Solution
There are 3 Steps involved in it

Get step-by-step solutions from verified subject matter experts