

Question: I need help on what to do for Year 9 of the Globus simulation? I am not sure how to meet all of the investors
I need help on what to do for Year 9 of the Globus simulation? I am not sure how to meet all of the investors goals for the next year.
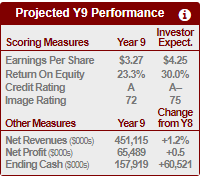
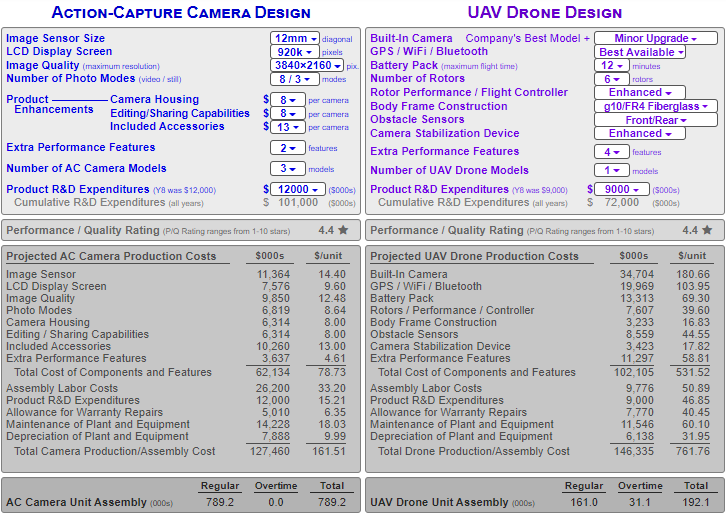
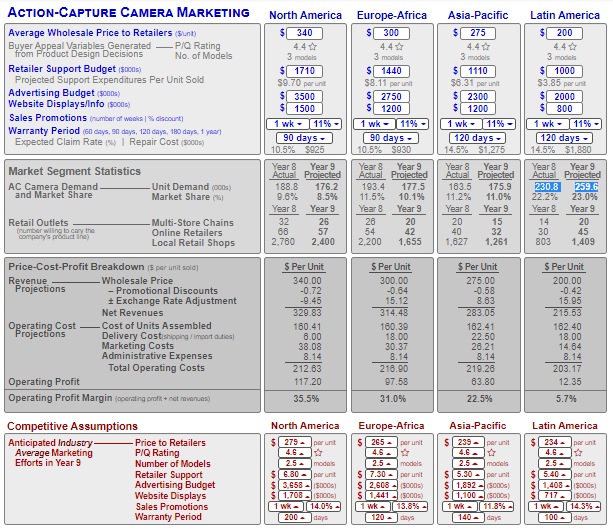
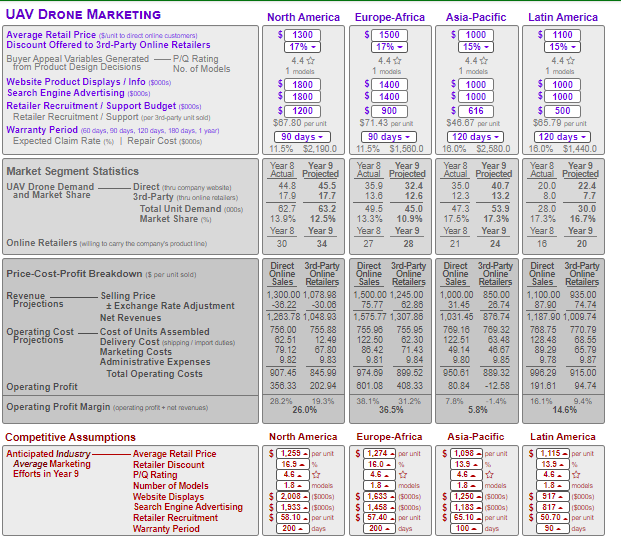
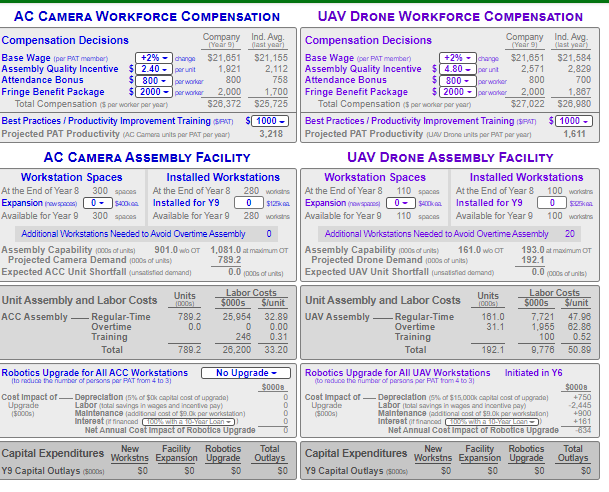
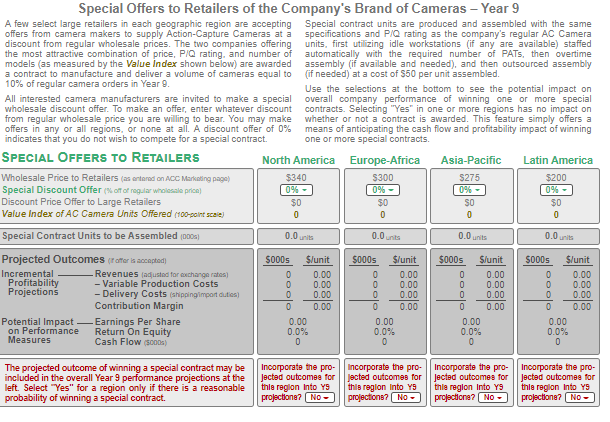
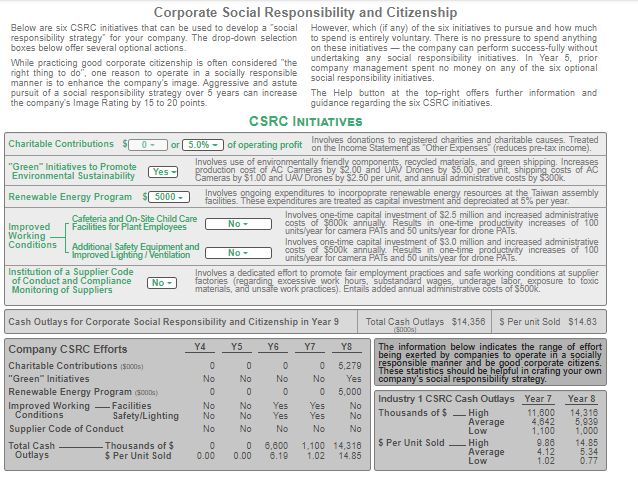
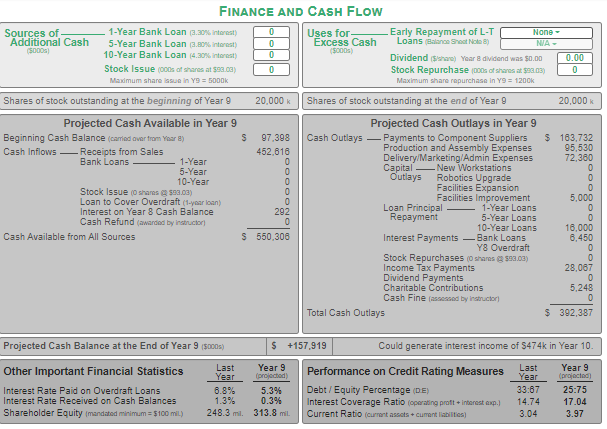
Projected Y9 Performance o Investor Scoring Measures Year 9 Expect. Earnings Per Share $3.27 $4.25 Retum On Equity 23.3% 30.0% Credit Rating A A- Image Rating 72 75 Change Other Measures Year 9 from Y8 Net Revenues (5000) 451,115 +1.2% Net Profit (5000) 65,489 +0.5 Ending Cash (5000) 157,919 +60,521 per camera models ACTION-CAPTURE CAMERA DESIGN UAV DRONE DESIGN Image Sensor Size 12mm dingenal Built-In Camera Company's Best Model + Minor Upgrade - LCD Display Screen 920k - pixels GPS / WiFi / Bluetooth Best Available Image Quality (maximum resolution) 3840x2160 Battery Pack (maximur flight time) 12 minutes Number of Photo Modes (video / stil) 8/3 modes Number of Rotors 6-rators Camera Housing Product Rotor Performance / Flight Controller Enhanced $ 8 - per camera Enhancements Editing/Sharing Capabilities $8. Body Frame Construction g10/FR4 Fiberglass Obstacle Sensors Front/Rear Included Accessories SI 13 per camera Camera Stabilization Device Enhanced Extra Performance Features 2-features Extra Performance Features 4-features Number of AC Camera Models models Number of UAV Drone Models 1- Product R&D Expenditures (va was $12,000) $ 12000 8000 Product R&D Expenditures (YB was 59,000) 9000 - (5000) Cumulative R&D Expenditures (all years) $ 101,000 (5000) Cumulative R&D Expenditures (all years) $ 72,000 (5000) Performance / Quality Rating Rating ranges from 1 stars) 4.4 * Performance / Quality Rating (Pio Rating ranges from 1-10 stars) 4.4 * Projected AC Camera Production Costs $000s $/unit Projected UAV Drone Production Costs $000s $/unit Image Sensor 11,364 14.40 Built-In Camera 34,704 180.66 LCD Display Screen 7,576 9.60 GPS / WiFi / Bluetooth 19.969 103.95 Image Quality 9.850 12.48 Battery Pack 13,313 69.30 Photo Modes 6.819 8.64 Rotors / Performance / Controller 7,607 39.60 Camera Housing 6.314 8.00 Body Frame Construction 3.233 16.83 Editing / Sharing Capabilities 6,314 8.00 Obstacle Sensors 8,559 44.55 Included Accessories 10,260 13.00 Camera Stabilization Device 3,423 17.82 Extra Performance Features 3,637 4.61 Extra Performance Features 11.297 58.81 Total Cost of Components and Features 62.134 78.73 Total Cost of Components and Features 102,105 531.52 Assembly Labor Costs 26,200 33.20 Assembly Labor Costs 9,776 50.89 Product R&D Expenditures 12.000 15.21 Product R&D Expenditures 9.000 46.85 Allowance for Warranty Repairs 5.010 6.35 Allowance for Warranty Repairs 7,770 40.45 Maintenance of Plant and Equipment 14,228 18.03 Maintenance of Plant and Equipment 11,546 60.10 Depreciation of Plant and Equipment 7.888 9.99 Depreciation of Plant and Equipment 6.138 31.95 Total Camera Production/Assembly Cost 127,460 161.51 Total Drone Production/Assembly Cost 146,335 761.76 AC Camera Unit Assembly (000s) Regular 789.2 Overtime 0.0 Total 789.2 UAV Drone Unit Assembly (000s) Regular 161.0 Overtime 31.1 Total 192.1 Asia-Pacific $ 275 4.4 3 models 3 models ACTION-CAPTURE CAMERA MARKETING Average Wholesale Price to Retailers (Sunit) Buyer Appeal Variables Generated P/Q Rating from Product Design Decisions No. of Models Retailer Support Budget $000) Projected Support Expenditures Per Unit Sold Advertising Budget (9000) Website Displays/Info (5000) Sales Promotions number of works discount) Warranty period days, 90 days, 120 days, 100 days 1 year Expected Claim Rate 19 Repair Cost ($000s) North America Europe Africa $340 $ 300 4.4 4.44 3 models $ 1710 $ 1440 $9.70 perut $8.11 per unit $ 3500 $ 2750 $ 1500 $ 1200 1 wk 11% 1 wk 11% 90 days - 90 days - 10.5% $925 10.5% $930 Year 8 Year 9 Year 8 Year 9 Actual Projected Actual Projected 188.8 176.2 193.4 177.5 9.6% 8.5% 11.5% 10.1% Year 8 Year 9 Year 8 Year 9 32 26 26 20 88 57 54 42 2.760 2,400 2,200 1,655 $1 1110 $6.31 per unit $ 2300 $ 1200 1 wk - 11% 120 days 14.5% $1,275 Year 8 Year 9 Actual Projected 163.5 175.9 11.2% 11.0% Year 8 Year 9 20 15 40 32 Latin America $ 200 4.4 3 models $ 1000 $3.85 perunt $ 2000 $ 800 1 wk 11% 120 days - 14.5% $1,880 Year 8 Year 9 Actual Projected 230.8 259.6 22.2% 23.0% Year 8 Year 9 14 20 30 45 803 1,409 Market Segment Statistics AC Camera Demand and Market Share Unit Demand (0) Market Share Retail Outlets (number willing to cay the company's producto) - Multi-Store Chains Online Retailers Local Retail Shops 1,627 1,261 Price-Cost-Profit Breakdown 15 per unit sold) Revenue Wholesale Price Projections - Promotional Discounts * Exchange Rate Adjustment Net Revenues Operating Cost -Cost of Units Assembled Projections Delivery Costshipping import duties Marketing Costs Administrative Expenses Total Operating costs Operating Profit Operating Profit Margin (operating prole + nat revenues) $ Per Unit 340.00 -0.72 -9.45 329.83 160.41 6.00 38.08 8.14 212.63 117.20 35.5% $ Per Unit 300.00 -0.64 15.12 314.48 160.39 18.00 30.37 8.14 216.90 97.58 31.0% $ Per Unit 275.00 -0.58 8.63 283.05 162.41 22.50 26.21 8.14 219.20 63.80 22.5% $ Per Unit 200.00 -0.42 15.95 215.53 162.40 18.00 14.64 8.14 203.17 12.35 5.7% Competitive Assumptions Anticipated Industry Price to Retailers Average Marketing PIQ Rating Efforts in Year 9 Number of Models Retailer Support Advertising Budget Website Displays Sales Promotions Warranty Period North America $ 279 -perunt 4.6. 2.5 models $6.80 - par unit $13.658 $000) $11.7088000) ( 1 wk 14.0% - 200 days Europe-Africa s 265 per unit 4.6. 2.5 models s 7.30 - per unit $ 2,608 (5000) $1,441 25000) 1 wk. 13.8% 120. days Asia-Pacific $ 239 per unit 4.6 2.5 models $5.30 - par unit $ 1,892 (5000) S[1,100 - 5000) 1 wk 11.8% - 140 days Latin America $ 234 perunt 4.6. 2.5. models $5.40 per unit $ 11,408 5000) $ [ 717 (5000) 1 Wk- 14.3% 100 days Asia-Pacific $ 1000 15% - UAV DRONE MARKETING Average Retail Price (Sant to direct online customers! Discount Offered to 3rd-Party Online Retailers Buyer Appeal Variables Generated P/Q Rating from Product Design Decisions No. of Models Website Product Displays / Info $600) Search Engine Advertising (5000) Retailer Recruitment / Support Budget (5000) Retailer Recruitment / Support (per ard-party unit sold Warranty Period days, 30 days, 120 days, 100 days. 1 year Expected Claim Rate (9) Repair Cost(5000s) North America Europe Africa $ 1300 $ 1500 17% - 17% - 4.4 4.41 1 models 1 medias $ 1800 S 1400 $ 1800 S 1400 $ 1200 S 900 $67.80 per unit $71.43 per un 90 days 90 days 11.5% $2,190.0 11.5% $1,580.0 Year 8 Year 9 Year 8 Year 9 Actual Projected Actual Projected 44.8 45.5 35.9 32.4 17.9 17.7 13.8 12.6 62.7 45.0 13.9% 12.5% 13.3% 10.9% Year 8 Year 9 Year 8 Year 9 30 34 27 28 1 models $ 1000 $ 1000 $ 616 $46.87 perunt 120 days 16.0% $2,580.0 Year 8 Year 9 Actual Projected 35.0 40.7 12.3 13.2 47.3 53.9 17.5% 17.3% Year 8 Year 9 21 24 Latin America $ 1100 15% - 4.4 1 models $ 1000 $1 1000 $ 500 $65.79 per unit 120 days 16.0% $1,440.0 Year 8 Year 9 Actual Projected 20.0 22.4 8.0 7.7 28.0 30.0 17.3% 16.7% Year 8 Year 9 16 20 Market Segment Statistics UAV Drone Demand Direct ( company website and Market Share 3rd-Party thru online retalers) Total Unit Demand (000) Market Share 63.2 49.5 Online Retailers willing to carry the company's product line) Price-Cost-Profit Breakdown (5 per unit sola Revenue Selling Price Projections i Exchange Rate Adjustment Net Revenues Operating Cost -Cost of Units Assembled Projections Delivery Cost (shipping / import duties) Marketing Costs Administrative Expenses Total Operating Costs Operating Profit Operating Profit Margin (operating profit net revenues) Direct3rd-Party Online Online Sales Retailers 1,300.00 1,078.98 -36.22 -30.06 1,263.78 1,048.93 758.00 755.88 62.51 12.49 79.12 67.80 9.82 9.83 907.45 845.99 356.33 202.94 26.29 19.3% 26.0% Direct3rd-Party Online Online Sales Retailers 1,500.00 1,245.00 75.77 62.88 1.575.77 1,307.86 755.98 755.95 122.50 62.30 88.42 71.43 9.81 9.84 974.69 890.52 601.08 408.33 38.1% 31.2% 36.5% Direct 3rd-Party Online Online Sales Retailers 1,000.00 850.00 31.45 26.74 1,031.45 878.74 769.16 769.32 122.51 63.48 49.14 46.67 9.80 9.85 950.61 889.32 80.84 -12.58 7.8% -1.4% Direct3rd-Party Online Online Sales Retailers 1,100.00 935.00 87.90 74.74 1,187.90 1,009.74 788.75 770.79 128.48 88.56 89.29 85.79 9.78 9.87 996.29 915.00 191.61 94.74 16.1% 9.4% 14.6% 5.8% North America $ 1.255 Ipar unt 16.9 Asia-Pacific $(1,098 per unit 13.9 Latin America $1.115 Ipar unt 13.9.) Competitive ssumptions Anticipated Industry Average Retail Price Average Marketing Retailer Discount Efforts in Year 9 PIQ Rating Number of Models Website Displays Search Engine Advertising Retailer Recruitment Warranty Period 1.8. models $2008 5000) $11.933 5000) $53.10 -perunt 200 days Europe-Africa S (1.274 per unit 16.0) 4.6. 1.8 models $1,6333000) s(1,458 (5000) S 57.40 per unit 200 days 1.8 models $1,250 (5000) $ 1,183 (5000) S65.10 per unit 100 days 1.8 - models $9175000 $1 817 - SOCO $50.70 por unt 90 days (Year 9) (Year 91 (last year) 1,921 AC CAMERA WORKFORCE COMPENSATION Compensation Decisions Company Ind. Ang last year Base Wage per PAT member) +2% chans $21,651 $21,155 Assembly Quality Incentive $2.40 per unit 2,112 Attendance Bonus $ 800 - pro 800 758 Fringe Benefit Package $2000-perworlar 2.000 1,700 Total Compensation (5 per worker per year) $26,372 $25.725 Best Practices / Productivity Improvement Training SFAT) S 1000 - Projected PAT Productivity (AC Camera units par PAT per year) 3,218 AC CAMERA ASSEMBLY FACILITY Workstation Spaces Installed Workstations At the End of Year 8 300 Spas At the End of Year 8 280 words Expansion rows 0 - 54000 Installed for Y9 0 S12 Available for Year 9 Available for Year o 280 worst Additional Workstations Needed to Avoid Overtime Assembly 0 Assembly Capability_1000s unita) 901.0 wo OT 1,081.0 at maximum OT Projected Camera Demand (000s of units) 7892 Expected ACC Unit Shortfall (unsatisfied demand 0.0000s of us UAV DRONE WORKFORCE COMPENSATION Compensation Decisions Company Ind. Aug Base Wage par PAT member) +2% - change $21,651 $21,584 Assembly Quality Incentive $ 4.80 -print 2.571 2.829 Attendance Bonus $800-perwork 800 700 Fringe Benefit Package $ 2000 - 2.000 1.887 Total Compensation (5 per worker per year) $27,022 $26.980 Best Practices / Productivity Improvement Training ST) $(1000 Projected PAT Productivity (WAV Drane uits par PAT par yaar) 1,611 UAV DRONE ASSEMBLY FACILITY Workstation Spaces Installed Workstations At the End of Year 8 { 110 Spaces At the End of Year 8 100 words Expansion now 0-S Installed for Y9 0 SOK Available for Year 9 Available for Year o 100 words Additional Workstations Needed to Avoid Overtime Assembly 20 Assembly Capability (000s of units) 161.0 WOOT 193.0 at mamum OT Projected Drone Demand (000s of units) 192.1 Expected UAV Unit Shortfall unsatisfied demand) 0.0 (000s of units 300 110 Units 1000) Unit Assembly and Labor Costs ACC Assembly Regular-Time Overtime Training Total 7892 0.0 Labor Costs $000s S/unit 25,954 32.89 0 0.00 246 0.31 26,200 33.20 Unit Assembly and Labor Costs UAV Assembly Regular-Time Overtime Training Total Units 1000) 161.0 31.1 Labor Costs 5000s $/unit 7,721 47.90 1.955 62.88 100 0.52 9,776 50.89 789.2 192.1 Robotics Upgrade for All ACC Workstations No Upgrade- to reduce the number of persons per PAT from 4 to 31 $0000 Cost Impact of Depreciation (5% of capital cost of upgrade 0 Upgrade Labor (total savings in wages and incentivo pay 0 15000 Maintenance additional cost of $9.0k per workstation) 0 Interest and Crosswitha 10-Year Loan Net Annual Cost impact of Robotica Upgrade New Facility Robotics Total Capital Expenditures Workstns Expansion Upgrade Outlays Y9 Capital Outlays (5000) SO SO SO SO Robotics Upgrade for All UAV Workstations Initiated in Y6 (to noduce the number of persons por PAT from 4 to 31 $0008 Coat Impact of Depreciation (5% of $15.000 capital cost of upgrade) +750 Upgrade Labor total savings in wags and incentive pay -2.445 (5000) Maintenance additional cost of $10k per workstation) 4900 Interest of financed GDYNAND +181 Net Annual Cost Impact of Robotics Upgrade New Robotics Facility Total Capital Expenditures Workstns Expansion Upgrade Outlays Y9 Capital Outlays (5000) SO SO SO SO Special Offers to Retailers of the Company's Brand of Cameras - Year 9 A few select large retailers in each geographic region are accepting Special contract units are produced and assembled with the same offers from camera makers to supply Action-Capture Cameras at a specifications and P/Q rating as the company's regular AC Camera discount from regular Wholesale prices. The two companies offering units, first utilizing idle workstations (if any are available) staffed the most attractive combination of price, P/Q rating, and number of automatically with the required number of PATS, then overtime models (as measured by the Value Index shown below) are awarded assembly (if available and needed), and then outsourced assembly a contract to manufacture and deliver a volume of cameras equal to (if needed) at a cost of $50 per unit assembled. 10% of regular camera orders in Year 9. Use the selections at the bottom to see the potential impact on All interested camera manufacturers are invited to make a special overall company performance of winning one or more special wholesale discount offer. To make an offer, enter whatever discount contracts. Selecting "Yes" in one or more regions has no impact on from regular wholesale price you are willing to bear. You may make whether or not a contract is awarded. This feature simply offers a offers in any or all regions, or none at all. A discount offer of 0% means of anticipating the cash flow and profitability impact of winning indicates that you do not wish to compete for a special contract. one or more special contracts. SPECIAL OFFERS TO RETAILERS North America Europe Africa Asia-Pacific Latin America Wholesale Price to Retailers (as antrad on ACC Marketing page) $340 $300 $275 $200 Special Discount Offer (ort of regular wholesale price) 0% - 0%- Discount Price Offer to Large Retailers $0 $0 SO $0 Value Index of AC Camera Units Offered (900-point scale) 0 0 0 0 Special Contract Units to be Assembled (2005) Projected Outcomes (raffar is accepted) $000s $/unit S000s $/unit $000s Slunit $000s $/unit Incremental Revenues adjusted for exchange rates) 0.00 0 0.00 0.00 0 0.00 Profitability - Variable Production Costs 0.00 0 0.00 0.00 0 0.00 Projections - Delivery Costs (shipping import duties) 0.00 0 0.00 0.00 0.00 Contribution Margin 0.00 0 0.00 0.00 0 0.00 Potential Impact Earnings Per Share 0.00 0.00 0.00 0.00 on Performance Return On Equity 0.0% 0.0% 0.0% 0.0% Measures Cash Flow (5000) 0 0 0 0 0.0 0.0 units 0.0 units 0.0 units OOOO OO The projected outcome of winning a special contract may be included in the overall Year 9 performance projections at the left. Select "Yes" for a region only if there is a reasonable probability of winning a special contract. Incorporate the pro- Jected outcomes for thla region Into YS projectiona? No Incorporate the pro-Incorporate the pro-Incorporate the pro- jected outcomes for Jected outcomes for Jected outcomes for this region into Y9 the region Into Y9 the region Into YS projections? No projectione? No- projectiona? NO- Corporate Social Responsibility and Citizenship Below are six CSRC initiatives that can be used to develop a 'social However, which (if any) of the six initiatives to pursue and how much responsibility strategy for your company. The drop-down selection to spend is entirely voluntary. There is no pressure to spend anything boxes below offer several optional actions. on these initiatives the company can perform successfully without While practicing good corporate citizenship is often considered "the undertaking any social responsibility initiatives. In Year 5. prior right thing to do". one reason to operate in a socially responsible company management spent no money on any of the six optional manner is to enhance the company's image. Aggressive and astute social responsibility initiatives. pursuit of a social responsibility strategy over 5 years can increase The Help button at the top-right offers further information and the company's Image Rating by 15 to 20 points. guidance regarding the six CSRC initiatives CSRC INITIATIVES Charitable Contributions or 5.0% of operating profit on the Income Statement as Other Expenses reduces pre-tax income). Involves donations to registered charities and charitable causes. Treated "Green" Initiatives to promote Involves use of environmentally friendly components, recycled materials and green shipping. Increases Environmental Sustainability production cost of AC Cameras by $2.00 and UAV Drones by $5.00 per unit, shipping costs of AD Cameras by $1.00 and UAV Drones by $2.50 per unit, and annual administrative costs by $300k. Renewable Energy Program 5000 Involves ongoing expenditures to incorporate renewable energy resources at the Taiwan assembly facilities. These expenditures are treated as capital investment and depreciated at 5% per year. Cafeteria and On-Site Child Care Involves one-time capital investment of $2.5 million and increased administrative Improved Facilities for Plant Employees No- units/year for camera PATs and 50 units/year for costs of $800k annually. Results in one-time productivity increases of 100 PATS Working Conditions Additional Safety Equipment and Involves one-time capital investment of $3.0 million and increased administrative Improved Lighting / Ventilation No- costs of $500k annually. Results in one-time productivity increases of 100 units/year for camera PATS and 50 units year for drone PATS. Institution of a Supplier Code Involves a dedicated effort to promote fair employment practices and safe working conditions at supplier of Conduct and Compliance No factories regarding excessive work hours, substandard wages, underage labor exposure to foxic Monitoring of Suppliers materials, and unsafe work practices). Entails added annual administrative costs of $500k. Yes Y7_ Yes Cash Outlays for Corporate Social Responsibility and Citizenship in Year 9 Total Cash Outlays $14,356 S Per unit Sold $14.63 (S000 Y4 Y5 Company CSRC Efforts Y6 YS The information below indicates the range of effort being exerted by companies to operate in a socially Charitable Contributions (5000) 0 0 0 0 5,279 responsible manner and be good corporate citizens. These statistics should be helpful in crafing your own "Green" Initiatives No No No No company's social responsibility strategy. Renewable Energy Program (5000) 0 0 0 0 5,000 Industry 1 CSRC Cash Outlays Year 7 Year 8 Improved Working Facilities No No Yes Yes No Conditions Safety/Lighting No No Yes Yes No Thousands of $ High 11.800 14,316 Average 4,642 5,939 Supplier Code of Conduct No No No No No Low 1.100 1.000 Total Cash Thousands of $ 0 0 6.800 1,100 14,316 $ Per Unit Sold High 9.88 14.85 Outlays $ Per Unit Sold 0.00 0.00 6.19 1.02 14.85 Average 4.12 5.34 Low 1.02 0.77 FINANCE AND CASH FLOW Sources of 1-Year Bank Loan (20% tors) 0 Uses for Early Repayment of L-T None - Additional Cash 5-Year Bank Loan 3.80% interest) 0 Excess Cash Loans Balance Shoot Nole NA- (5000) 10-Year Bank Loan 4.30% interest 0 (5000) Dividends) Your dividend was $0.00 0.00 Stock Issue (000s of shares at $28.00) 0 Stock Repurchases of shares at $93.03) 0 Maximum share issue in Y9 = 5000k Maximum share repurchase in Y9 = 1200k Shares of stock outstanding at the beginning of Year 9 20.000 Shares of stock outstanding at the end of Year 9 20,000 Projected Cash Available in Year 9 Projected Cash Outlays in Year 9 Beginning Cash Balance (carried over from Year) S 97.398 Cash Outlays Payments to Component Suppliers $ 163,732 452.618 Cash Inflows -Receipts from Sales 95,530 Production and Assembly Expenses 1-Year Bank Loans 72,360 0 Delivery/Marketing/Admin Expenses 5-Year 0 Capital 0 New Workstations 10-Year 0 Outlays 0 Robotics Upgrade Stock Issue (shares @ 99.02) 0 0 Facilities Expansion Facilities Improvement 5,000 Loan to Cover Overdraft (1-year loan) 0 292 Interest on Year 8 Cash Balance Loan Principal 0 1-Year Loans Cash Refund awarded by instructor 0 Repayment 5-Year Loans 0 10-Year Loans 16,000 Cash Available from All Sources S 550.306 Interest Payments Bank Loans 6,450 Y8 Overdraft 0 Stock Repurchases (0 shares @ 592.08) 0 Income Tax Payments 28,067 Dividend Payments 0 Charitable Contributions 5,248 Cash Finessed by instructor 0 Total Cash Outlays $ 392,387 Projected Cash Balance at the End of Year 9 (5000s) $ +157,919 Could generate interest income of $474k in Year 10. Other Important Financial Statistics Last Year 9 Last Year 9 Year Performance on Credit Rating Measures (projected) Year (project Interest Rate Paid on Overdraft Loans 6.8% 5.3% Debt / Equity Percentage (DE) 33:67 25:75 Interest Rate Received on Cash Balances 1.3% 0.3% Interest Coverage Ratio operating proftinterest exp. 14.74 17.04 Shareholder Equity mandated minimum = $100 ml) 248.3 ml. 313.8 mil. Current Ratio (current assas + cuman labios 3.04 3.97 Projected Y9 Performance o Investor Scoring Measures Year 9 Expect. Earnings Per Share $3.27 $4.25 Retum On Equity 23.3% 30.0% Credit Rating A A- Image Rating 72 75 Change Other Measures Year 9 from Y8 Net Revenues (5000) 451,115 +1.2% Net Profit (5000) 65,489 +0.5 Ending Cash (5000) 157,919 +60,521 per camera models ACTION-CAPTURE CAMERA DESIGN UAV DRONE DESIGN Image Sensor Size 12mm dingenal Built-In Camera Company's Best Model + Minor Upgrade - LCD Display Screen 920k - pixels GPS / WiFi / Bluetooth Best Available Image Quality (maximum resolution) 3840x2160 Battery Pack (maximur flight time) 12 minutes Number of Photo Modes (video / stil) 8/3 modes Number of Rotors 6-rators Camera Housing Product Rotor Performance / Flight Controller Enhanced $ 8 - per camera Enhancements Editing/Sharing Capabilities $8. Body Frame Construction g10/FR4 Fiberglass Obstacle Sensors Front/Rear Included Accessories SI 13 per camera Camera Stabilization Device Enhanced Extra Performance Features 2-features Extra Performance Features 4-features Number of AC Camera Models models Number of UAV Drone Models 1- Product R&D Expenditures (va was $12,000) $ 12000 8000 Product R&D Expenditures (YB was 59,000) 9000 - (5000) Cumulative R&D Expenditures (all years) $ 101,000 (5000) Cumulative R&D Expenditures (all years) $ 72,000 (5000) Performance / Quality Rating Rating ranges from 1 stars) 4.4 * Performance / Quality Rating (Pio Rating ranges from 1-10 stars) 4.4 * Projected AC Camera Production Costs $000s $/unit Projected UAV Drone Production Costs $000s $/unit Image Sensor 11,364 14.40 Built-In Camera 34,704 180.66 LCD Display Screen 7,576 9.60 GPS / WiFi / Bluetooth 19.969 103.95 Image Quality 9.850 12.48 Battery Pack 13,313 69.30 Photo Modes 6.819 8.64 Rotors / Performance / Controller 7,607 39.60 Camera Housing 6.314 8.00 Body Frame Construction 3.233 16.83 Editing / Sharing Capabilities 6,314 8.00 Obstacle Sensors 8,559 44.55 Included Accessories 10,260 13.00 Camera Stabilization Device 3,423 17.82 Extra Performance Features 3,637 4.61 Extra Performance Features 11.297 58.81 Total Cost of Components and Features 62.134 78.73 Total Cost of Components and Features 102,105 531.52 Assembly Labor Costs 26,200 33.20 Assembly Labor Costs 9,776 50.89 Product R&D Expenditures 12.000 15.21 Product R&D Expenditures 9.000 46.85 Allowance for Warranty Repairs 5.010 6.35 Allowance for Warranty Repairs 7,770 40.45 Maintenance of Plant and Equipment 14,228 18.03 Maintenance of Plant and Equipment 11,546 60.10 Depreciation of Plant and Equipment 7.888 9.99 Depreciation of Plant and Equipment 6.138 31.95 Total Camera Production/Assembly Cost 127,460 161.51 Total Drone Production/Assembly Cost 146,335 761.76 AC Camera Unit Assembly (000s) Regular 789.2 Overtime 0.0 Total 789.2 UAV Drone Unit Assembly (000s) Regular 161.0 Overtime 31.1 Total 192.1 Asia-Pacific $ 275 4.4 3 models 3 models ACTION-CAPTURE CAMERA MARKETING Average Wholesale Price to Retailers (Sunit) Buyer Appeal Variables Generated P/Q Rating from Product Design Decisions No. of Models Retailer Support Budget $000) Projected Support Expenditures Per Unit Sold Advertising Budget (9000) Website Displays/Info (5000) Sales Promotions number of works discount) Warranty period days, 90 days, 120 days, 100 days 1 year Expected Claim Rate 19 Repair Cost ($000s) North America Europe Africa $340 $ 300 4.4 4.44 3 models $ 1710 $ 1440 $9.70 perut $8.11 per unit $ 3500 $ 2750 $ 1500 $ 1200 1 wk 11% 1 wk 11% 90 days - 90 days - 10.5% $925 10.5% $930 Year 8 Year 9 Year 8 Year 9 Actual Projected Actual Projected 188.8 176.2 193.4 177.5 9.6% 8.5% 11.5% 10.1% Year 8 Year 9 Year 8 Year 9 32 26 26 20 88 57 54 42 2.760 2,400 2,200 1,655 $1 1110 $6.31 per unit $ 2300 $ 1200 1 wk - 11% 120 days 14.5% $1,275 Year 8 Year 9 Actual Projected 163.5 175.9 11.2% 11.0% Year 8 Year 9 20 15 40 32 Latin America $ 200 4.4 3 models $ 1000 $3.85 perunt $ 2000 $ 800 1 wk 11% 120 days - 14.5% $1,880 Year 8 Year 9 Actual Projected 230.8 259.6 22.2% 23.0% Year 8 Year 9 14 20 30 45 803 1,409 Market Segment Statistics AC Camera Demand and Market Share Unit Demand (0) Market Share Retail Outlets (number willing to cay the company's producto) - Multi-Store Chains Online Retailers Local Retail Shops 1,627 1,261 Price-Cost-Profit Breakdown 15 per unit sold) Revenue Wholesale Price Projections - Promotional Discounts * Exchange Rate Adjustment Net Revenues Operating Cost -Cost of Units Assembled Projections Delivery Costshipping import duties Marketing Costs Administrative Expenses Total Operating costs Operating Profit Operating Profit Margin (operating prole + nat revenues) $ Per Unit 340.00 -0.72 -9.45 329.83 160.41 6.00 38.08 8.14 212.63 117.20 35.5% $ Per Unit 300.00 -0.64 15.12 314.48 160.39 18.00 30.37 8.14 216.90 97.58 31.0% $ Per Unit 275.00 -0.58 8.63 283.05 162.41 22.50 26.21 8.14 219.20 63.80 22.5% $ Per Unit 200.00 -0.42 15.95 215.53 162.40 18.00 14.64 8.14 203.17 12.35 5.7% Competitive Assumptions Anticipated Industry Price to Retailers Average Marketing PIQ Rating Efforts in Year 9 Number of Models Retailer Support Advertising Budget Website Displays Sales Promotions Warranty Period North America $ 279 -perunt 4.6. 2.5 models $6.80 - par unit $13.658 $000) $11.7088000) ( 1 wk 14.0% - 200 days Europe-Africa s 265 per unit 4.6. 2.5 models s 7.30 - per unit $ 2,608 (5000) $1,441 25000) 1 wk. 13.8% 120. days Asia-Pacific $ 239 per unit 4.6 2.5 models $5.30 - par unit $ 1,892 (5000) S[1,100 - 5000) 1 wk 11.8% - 140 days Latin America $ 234 perunt 4.6. 2.5. models $5.40 per unit $ 11,408 5000) $ [ 717 (5000) 1 Wk- 14.3% 100 days Asia-Pacific $ 1000 15% - UAV DRONE MARKETING Average Retail Price (Sant to direct online customers! Discount Offered to 3rd-Party Online Retailers Buyer Appeal Variables Generated P/Q Rating from Product Design Decisions No. of Models Website Product Displays / Info $600) Search Engine Advertising (5000) Retailer Recruitment / Support Budget (5000) Retailer Recruitment / Support (per ard-party unit sold Warranty Period days, 30 days, 120 days, 100 days. 1 year Expected Claim Rate (9) Repair Cost(5000s) North America Europe Africa $ 1300 $ 1500 17% - 17% - 4.4 4.41 1 models 1 medias $ 1800 S 1400 $ 1800 S 1400 $ 1200 S 900 $67.80 per unit $71.43 per un 90 days 90 days 11.5% $2,190.0 11.5% $1,580.0 Year 8 Year 9 Year 8 Year 9 Actual Projected Actual Projected 44.8 45.5 35.9 32.4 17.9 17.7 13.8 12.6 62.7 45.0 13.9% 12.5% 13.3% 10.9% Year 8 Year 9 Year 8 Year 9 30 34 27 28 1 models $ 1000 $ 1000 $ 616 $46.87 perunt 120 days 16.0% $2,580.0 Year 8 Year 9 Actual Projected 35.0 40.7 12.3 13.2 47.3 53.9 17.5% 17.3% Year 8 Year 9 21 24 Latin America $ 1100 15% - 4.4 1 models $ 1000 $1 1000 $ 500 $65.79 per unit 120 days 16.0% $1,440.0 Year 8 Year 9 Actual Projected 20.0 22.4 8.0 7.7 28.0 30.0 17.3% 16.7% Year 8 Year 9 16 20 Market Segment Statistics UAV Drone Demand Direct ( company website and Market Share 3rd-Party thru online retalers) Total Unit Demand (000) Market Share 63.2 49.5 Online Retailers willing to carry the company's product line) Price-Cost-Profit Breakdown (5 per unit sola Revenue Selling Price Projections i Exchange Rate Adjustment Net Revenues Operating Cost -Cost of Units Assembled Projections Delivery Cost (shipping / import duties) Marketing Costs Administrative Expenses Total Operating Costs Operating Profit Operating Profit Margin (operating profit net revenues) Direct3rd-Party Online Online Sales Retailers 1,300.00 1,078.98 -36.22 -30.06 1,263.78 1,048.93 758.00 755.88 62.51 12.49 79.12 67.80 9.82 9.83 907.45 845.99 356.33 202.94 26.29 19.3% 26.0% Direct3rd-Party Online Online Sales Retailers 1,500.00 1,245.00 75.77 62.88 1.575.77 1,307.86 755.98 755.95 122.50 62.30 88.42 71.43 9.81 9.84 974.69 890.52 601.08 408.33 38.1% 31.2% 36.5% Direct 3rd-Party Online Online Sales Retailers 1,000.00 850.00 31.45 26.74 1,031.45 878.74 769.16 769.32 122.51 63.48 49.14 46.67 9.80 9.85 950.61 889.32 80.84 -12.58 7.8% -1.4% Direct3rd-Party Online Online Sales Retailers 1,100.00 935.00 87.90 74.74 1,187.90 1,009.74 788.75 770.79 128.48 88.56 89.29 85.79 9.78 9.87 996.29 915.00 191.61 94.74 16.1% 9.4% 14.6% 5.8% North America $ 1.255 Ipar unt 16.9 Asia-Pacific $(1,098 per unit 13.9 Latin America $1.115 Ipar unt 13.9.) Competitive ssumptions Anticipated Industry Average Retail Price Average Marketing Retailer Discount Efforts in Year 9 PIQ Rating Number of Models Website Displays Search Engine Advertising Retailer Recruitment Warranty Period 1.8. models $2008 5000) $11.933 5000) $53.10 -perunt 200 days Europe-Africa S (1.274 per unit 16.0) 4.6. 1.8 models $1,6333000) s(1,458 (5000) S 57.40 per unit 200 days 1.8 models $1,250 (5000) $ 1,183 (5000) S65.10 per unit 100 days 1.8 - models $9175000 $1 817 - SOCO $50.70 por unt 90 days (Year 9) (Year 91 (last year) 1,921 AC CAMERA WORKFORCE COMPENSATION Compensation Decisions Company Ind. Ang last year Base Wage per PAT member) +2% chans $21,651 $21,155 Assembly Quality Incentive $2.40 per unit 2,112 Attendance Bonus $ 800 - pro 800 758 Fringe Benefit Package $2000-perworlar 2.000 1,700 Total Compensation (5 per worker per year) $26,372 $25.725 Best Practices / Productivity Improvement Training SFAT) S 1000 - Projected PAT Productivity (AC Camera units par PAT per year) 3,218 AC CAMERA ASSEMBLY FACILITY Workstation Spaces Installed Workstations At the End of Year 8 300 Spas At the End of Year 8 280 words Expansion rows 0 - 54000 Installed for Y9 0 S12 Available for Year 9 Available for Year o 280 worst Additional Workstations Needed to Avoid Overtime Assembly 0 Assembly Capability_1000s unita) 901.0 wo OT 1,081.0 at maximum OT Projected Camera Demand (000s of units) 7892 Expected ACC Unit Shortfall (unsatisfied demand 0.0000s of us UAV DRONE WORKFORCE COMPENSATION Compensation Decisions Company Ind. Aug Base Wage par PAT member) +2% - change $21,651 $21,584 Assembly Quality Incentive $ 4.80 -print 2.571 2.829 Attendance Bonus $800-perwork 800 700 Fringe Benefit Package $ 2000 - 2.000 1.887 Total Compensation (5 per worker per year) $27,022 $26.980 Best Practices / Productivity Improvement Training ST) $(1000 Projected PAT Productivity (WAV Drane uits par PAT par yaar) 1,611 UAV DRONE ASSEMBLY FACILITY Workstation Spaces Installed Workstations At the End of Year 8 { 110 Spaces At the End of Year 8 100 words Expansion now 0-S Installed for Y9 0 SOK Available for Year 9 Available for Year o 100 words Additional Workstations Needed to Avoid Overtime Assembly 20 Assembly Capability (000s of units) 161.0 WOOT 193.0 at mamum OT Projected Drone Demand (000s of units) 192.1 Expected UAV Unit Shortfall unsatisfied demand) 0.0 (000s of units 300 110 Units 1000) Unit Assembly and Labor Costs ACC Assembly Regular-Time Overtime Training Total 7892 0.0 Labor Costs $000s S/unit 25,954 32.89 0 0.00 246 0.31 26,200 33.20 Unit Assembly and Labor Costs UAV Assembly Regular-Time Overtime Training Total Units 1000) 161.0 31.1 Labor Costs 5000s $/unit 7,721 47.90 1.955 62.88 100 0.52 9,776 50.89 789.2 192.1 Robotics Upgrade for All ACC Workstations No Upgrade- to reduce the number of persons per PAT from 4 to 31 $0000 Cost Impact of Depreciation (5% of capital cost of upgrade 0 Upgrade Labor (total savings in wages and incentivo pay 0 15000 Maintenance additional cost of $9.0k per workstation) 0 Interest and Crosswitha 10-Year Loan Net Annual Cost impact of Robotica Upgrade New Facility Robotics Total Capital Expenditures Workstns Expansion Upgrade Outlays Y9 Capital Outlays (5000) SO SO SO SO Robotics Upgrade for All UAV Workstations Initiated in Y6 (to noduce the number of persons por PAT from 4 to 31 $0008 Coat Impact of Depreciation (5% of $15.000 capital cost of upgrade) +750 Upgrade Labor total savings in wags and incentive pay -2.445 (5000) Maintenance additional cost of $10k per workstation) 4900 Interest of financed GDYNAND +181 Net Annual Cost Impact of Robotics Upgrade New Robotics Facility Total Capital Expenditures Workstns Expansion Upgrade Outlays Y9 Capital Outlays (5000) SO SO SO SO Special Offers to Retailers of the Company's Brand of Cameras - Year 9 A few select large retailers in each geographic region are accepting Special contract units are produced and assembled with the same offers from camera makers to supply Action-Capture Cameras at a specifications and P/Q rating as the company's regular AC Camera discount from regular Wholesale prices. The two companies offering units, first utilizing idle workstations (if any are available) staffed the most attractive combination of price, P/Q rating, and number of automatically with the required number of PATS, then overtime models (as measured by the Value Index shown below) are awarded assembly (if available and needed), and then outsourced assembly a contract to manufacture and deliver a volume of cameras equal to (if needed) at a cost of $50 per unit assembled. 10% of regular camera orders in Year 9. Use the selections at the bottom to see the potential impact on All interested camera manufacturers are invited to make a special overall company performance of winning one or more special wholesale discount offer. To make an offer, enter whatever discount contracts. Selecting "Yes" in one or more regions has no impact on from regular wholesale price you are willing to bear. You may make whether or not a contract is awarded. This feature simply offers a offers in any or all regions, or none at all. A discount offer of 0% means of anticipating the cash flow and profitability impact of winning indicates that you do not wish to compete for a special contract. one or more special contracts. SPECIAL OFFERS TO RETAILERS North America Europe Africa Asia-Pacific Latin America Wholesale Price to Retailers (as antrad on ACC Marketing page) $340 $300 $275 $200 Special Discount Offer (ort of regular wholesale price) 0% - 0%- Discount Price Offer to Large Retailers $0 $0 SO $0 Value Index of AC Camera Units Offered (900-point scale) 0 0 0 0 Special Contract Units to be Assembled (2005) Projected Outcomes (raffar is accepted) $000s $/unit S000s $/unit $000s Slunit $000s $/unit Incremental Revenues adjusted for exchange rates) 0.00 0 0.00 0.00 0 0.00 Profitability - Variable Production Costs 0.00 0 0.00 0.00 0 0.00 Projections - Delivery Costs (shipping import duties) 0.00 0 0.00 0.00 0.00 Contribution Margin 0.00 0 0.00 0.00 0 0.00 Potential Impact Earnings Per Share 0.00 0.00 0.00 0.00 on Performance Return On Equity 0.0% 0.0% 0.0% 0.0% Measures Cash Flow (5000) 0 0 0 0 0.0 0.0 units 0.0 units 0.0 units OOOO OO The projected outcome of winning a special contract may be included in the overall Year 9 performance projections at the left. Select "Yes" for a region only if there is a reasonable probability of winning a special contract. Incorporate the pro- Jected outcomes for thla region Into YS projectiona? No Incorporate the pro-Incorporate the pro-Incorporate the pro- jected outcomes for Jected outcomes for Jected outcomes for this region into Y9 the region Into Y9 the region Into YS projections? No projectione? No- projectiona? NO- Corporate Social Responsibility and Citizenship Below are six CSRC initiatives that can be used to develop a 'social However, which (if any) of the six initiatives to pursue and how much responsibility strategy for your company. The drop-down selection to spend is entirely voluntary. There is no pressure to spend anything boxes below offer several optional actions. on these initiatives the company can perform successfully without While practicing good corporate citizenship is often considered "the undertaking any social responsibility initiatives. In Year 5. prior right thing to do". one reason to operate in a socially responsible company management spent no money on any of the six optional manner is to enhance the company's image. Aggressive and astute social responsibility initiatives. pursuit of a social responsibility strategy over 5 years can increase The Help button at the top-right offers further information and the company's Image Rating by 15 to 20 points. guidance regarding the six CSRC initiatives CSRC INITIATIVES Charitable Contributions or 5.0% of operating profit on the Income Statement as Other Expenses reduces pre-tax income). Involves donations to registered charities and charitable causes. Treated "Green" Initiatives to promote Involves use of environmentally friendly components, recycled materials and green shipping. Increases Environmental Sustainability production cost of AC Cameras by $2.00 and UAV Drones by $5.00 per unit, shipping costs of AD Cameras by $1.00 and UAV Drones by $2.50 per unit, and annual administrative costs by $300k. Renewable Energy Program 5000 Involves ongoing expenditures to incorporate renewable energy resources at the Taiwan assembly facilities. These expenditures are treated as capital investment and depreciated at 5% per year. Cafeteria and On-Site Child Care Involves one-time capital investment of $2.5 million and increased administrative Improved Facilities for Plant Employees No- units/year for camera PATs and 50 units/year for costs of $800k annually. Results in one-time productivity increases of 100 PATS Working Conditions Additional Safety Equipment and Involves one-time capital investment of $3.0 million and increased administrative Improved Lighting / Ventilation No- costs of $500k annually. Results in one-time productivity increases of 100 units/year for camera PATS and 50 units year for drone PATS. Institution of a Supplier Code Involves a dedicated effort to promote fair employment practices and safe working conditions at supplier of Conduct and Compliance No factories regarding excessive work hours, substandard wages, underage labor exposure to foxic Monitoring of Suppliers materials, and unsafe work practices). Entails added annual administrative costs of $500k. Yes Y7_ Yes Cash Outlays for Corporate Social Responsibility and Citizenship in Year 9 Total Cash Outlays $14,356 S Per unit Sold $14.63 (S000 Y4 Y5 Company CSRC Efforts Y6 YS The information below indicates the range of effort being exerted by companies to operate in a socially Charitable Contributions (5000) 0 0 0 0 5,279 responsible manner and be good corporate citizens. These statistics should be helpful in crafing your own "Green" Initiatives No No No No company's social responsibility strategy. Renewable Energy Program (5000) 0 0 0 0 5,000 Industry 1 CSRC Cash Outlays Year 7 Year 8 Improved Working Facilities No No Yes Yes No Conditions Safety/Lighting No No Yes Yes No Thousands of $ High 11.800 14,316 Average 4,642 5,939 Supplier Code of Conduct No No No No No Low 1.100 1.000 Total Cash Thousands of $ 0 0 6.800 1,100 14,316 $ Per Unit Sold High 9.88 14.85 Outlays $ Per Unit Sold 0.00 0.00 6.19 1.02 14.85 Average 4.12 5.34 Low 1.02 0.77 FINANCE AND CASH FLOW Sources of 1-Year Bank Loan (20% tors) 0 Uses for Early Repayment of L-T None - Additional Cash 5-Year Bank Loan 3.80% interest) 0 Excess Cash Loans Balance Shoot Nole NA- (5000) 10-Year Bank Loan 4.30% interest 0 (5000) Dividends) Your dividend was $0.00 0.00 Stock Issue (000s of shares at $28.00) 0 Stock Repurchases of shares at $93.03) 0 Maximum share issue in Y9 = 5000k Maximum share repurchase in Y9 = 1200k Shares of stock outstanding at the beginning of Year 9 20.000 Shares of stock outstanding at the end of Year 9 20,000 Projected Cash Available in Year 9 Projected Cash Outlays in Year 9 Beginning Cash Balance (carried over from Year) S 97.398 Cash Outlays Payments to Component Suppliers $ 163,732 452.618 Cash Inflows -Receipts from Sales 95,530 Production and Assembly Expenses 1-Year Bank Loans 72,360 0 Delivery/Marketing/Admin Expenses 5-Year 0 Capital 0 New Workstations 10-Year 0 Outlays 0 Robotics Upgrade Stock Issue (shares @ 99.02) 0 0 Facilities Expansion Facilities Improvement 5,000 Loan to Cover Overdraft (1-year loan) 0 292 Interest on Year 8 Cash Balance Loan Principal 0 1-Year Loans Cash Refund awarded by instructor 0 Repayment 5-Year Loans 0 10-Year Loans 16,000 Cash Available from All Sources S 550.306 Interest Payments Bank Loans 6,450 Y8 Overdraft 0 Stock Repurchases (0 shares @ 592.08) 0 Income Tax Payments 28,067 Dividend Payments 0 Charitable Contributions 5,248 Cash Finessed by instructor 0 Total Cash Outlays $ 392,387 Projected Cash Balance at the End of Year 9 (5000s) $ +157,919 Could generate interest income of $474k in Year 10. Other Important Financial Statistics Last Year 9 Last Year 9 Year Performance on Credit Rating Measures (projected) Year (project Interest Rate Paid on Overdraft Loans 6.8% 5.3% Debt / Equity Percentage (DE) 33:67 25:75 Interest Rate Received on Cash Balances 1.3% 0.3% Interest Coverage Ratio operating proftinterest exp. 14.74 17.04 Shareholder Equity mandated minimum = $100 ml) 248.3 ml. 313.8 mil. Current Ratio (current assas + cuman labios 3.04 3.97
Step by Step Solution
There are 3 Steps involved in it

Get step-by-step solutions from verified subject matter experts