

Question: I need Help Please: I need to know the breakdown of how you calculate the Graph in Form 2.5 Please. Procedures: Read the entire exercise,
I need Help Please:
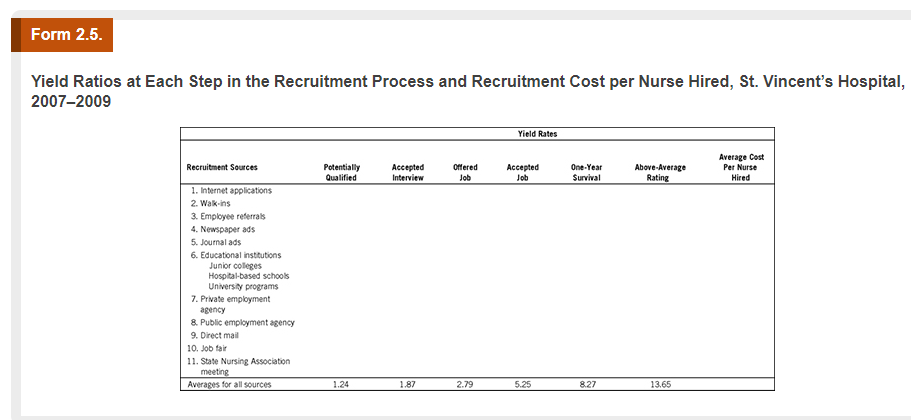
I need to know the breakdown of how you calculate the Graph in Form 2.5 Please.
Procedures:
Read the entire exercise, including the background on St. Vincents Hospital. Then, using the data provided in Exhibit 2.9, do the calculations on Form 2.5. A yield ratio is the number of applicants necessary to fill vacancies with qualified people. It is the relationship of applicant inputs to outputs at various decision points. For example, the yield ratio for all recruitment sources in Exhibit 2.9 shows that 273 nurse applicants were generated over the three-year period from 2007 to 2009. Since only 221 were classified as potentially qualified, the yield ratio is 273/221 or 1.24 to 1. The yield ratio for potentially qualified among walk-ins is 1.26 (53 42). The average cost per nurse hired among walk-ins is $119.23 ($1,550 13). Students should form groups of two to four students each and calculate the yield ratios for each recruitment source at each stage of the recruitment process on Form 2.5. These data show that the hospital needs to start with more than five times as many applicants as it needs to fill job openings and more than 13 times as many applicants as it hopes to have as above-average performers.
Exhibit2.9.Data on Recruitment Sources for Registered Nurses at St. Vincents Hospital, 20072009
| Recruitment Source | Number of Applicants | Potentially Qualified | Invitation for Interview | Qualified and Offered Job | Accepted Job | One-Year Survival | Above-Average Rating | Total Recruitment Costs |
|---|---|---|---|---|---|---|---|---|
| 1. Internet applications | 83 | 72 | 60 | 38 | 21 | 12 | 5 | $1,145 |
| 2. Walk-ins | 34 | 17 | 8 | 6 | 3 | 1 | 1 | 900 |
| 3. Employee referrals | 13 | 12 | 7 | 5 | 4 | 3 | 2 | 400 |
| 4. Newspaper ads | 24 | 16 | 8 | 4 | 2 | 1 | 0 | 750 |
| 5. Journal ads | 19 | 18 | 10 | 8 | 4 | 2 | 2 | 450 |
| 6. Educational institutions | ||||||||
| Junior colleges | 16 | 13 | 11 | 6 | 2 | 2 | 1 | 1,200 |
| Hospital-based schools | 8 | 8 | 3 | 2 | 1 | 0 | 0 | 800 |
| University programs | 24 | 24 | 16 | 14 | 10 | 8 | 7 | 1,300 |
| 7. Private employment agency | 9 | 9 | 8 | 5 | 2 | 2 | 1 | 4,000 |
| 8. Public employment agency | 8 | 4 | 2 | 1 | 1 | 0 | 0 | 600 |
| 9. Direct mail | 15 | 14 | 4 | 3 | 1 | 0 | 0 | 450 |
| 10. Job fair | 13 | 7 | 5 | 3 | 1 | 1 | 1 | 900 |
| 11. State Nursing Association meeting | 7 | 7 | 4 | 3 | 0 | 0 | 0 | 1,150 |
| Totals | 273 | 221 | 146 | 98 | 52 | 33 | 20 | $14,045 |
Do the calculations for Form 2.5 on your own prior to class. Think about the implications of these data for future recruitment at the hospital. Then, look at Exhibit 2.10 in conjunction with the background description and think about the implications for the recruiting process. During the class period, form groups of three to five, which will act as a consulting team for the hospital. With your group, discuss and answer the questions at the end of this exercise. At the end of the class period, have a spokesperson for each group discuss the groups answers and rationale with the entire class.
Exhibit2.10.Reasons for Nurse Rejection of a Job Offer from St. Vincents Hospital, 20072009
| Reason | Number | Percent |
|---|---|---|
| Recruitment Processes | ||
| Job attributes not communicated | 2 | 4.3 |
| The negative perception of a recruiter | 12 | 26.1 |
| The negative perception of hospital | 2 | 4.3 |
| Lack of timely follow-up | 13 | 28.3 |
| Perceived lack of honesty in the recruitment process | 1 | 2.2 |
| Negative information from the recruiter | 1 | 2.2 |
| Job Attributes | ||
| Location of hospital | 3 | 6.5 |
| Salary offer | 2 | 4.3 |
| Hours of work | 2 | 4.3 |
| Promotional opportunities | 0 | 0.0 |
| Fringe benefits | 0 | 0.0 |
| Working conditions | 3 | 6.5 |
| Perceived poor job match | 5 | 10.9 |
| Totals | 46 | 100.0 |
I need to know the breakdown of how you calculate the Graph in Form 2.5 Please.
Form 2.5. Yield Ratios at Each Step in the Recruitment Process and Recruitment Cost per Nurse Hired, St. Vincent's Hospital, 2007-2009 Yield Rates Recruitment Sources Potentially Qualified Accepted Interview Offered Job Accepted Job One-Year Survival Above-Average Rating Average Cost Per Nurse Hired 1. Internet applications 2. Walkins 3. Employee referrals 4. Newspaper ads 5. Journal ads 6. Educational institutions Junior colleges Hospital-based schools University programs 7. Private employment agency 8. Public employment agency 9. Direct mail 10. Job fair 11. State Nursing Association meeting Averages for all sources 1.24 1.87 2.79 5.25 8.27 13.65Step by Step Solution
There are 3 Steps involved in it

Get step-by-step solutions from verified subject matter experts