

Question: I need help plotting this in Matlab please! 17. Make a polar plot of the function: 90 4 120 60 30 The plot, shown in
I need help plotting this in Matlab please!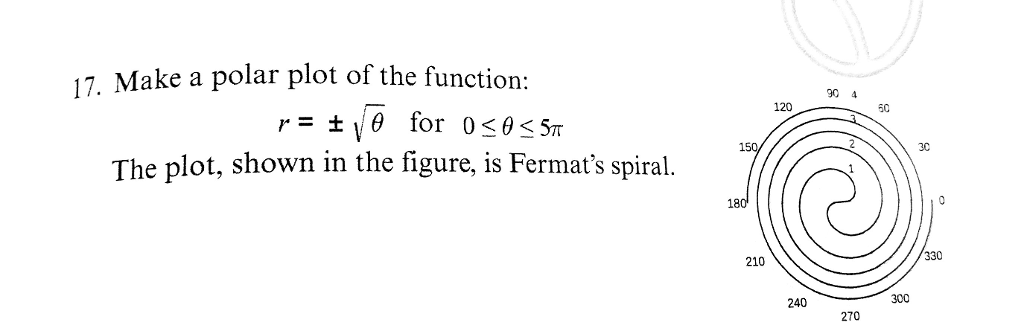
17. Make a polar plot of the function: 90 4 120 60 30 The plot, shown in the figure, is Fermat's spiral 180 330 210 /300 240 270
Step by Step Solution
There are 3 Steps involved in it
1 Expert Approved Answer
Step: 1 Unlock

Question Has Been Solved by an Expert!
Get step-by-step solutions from verified subject matter experts
Step: 2 Unlock
Step: 3 Unlock