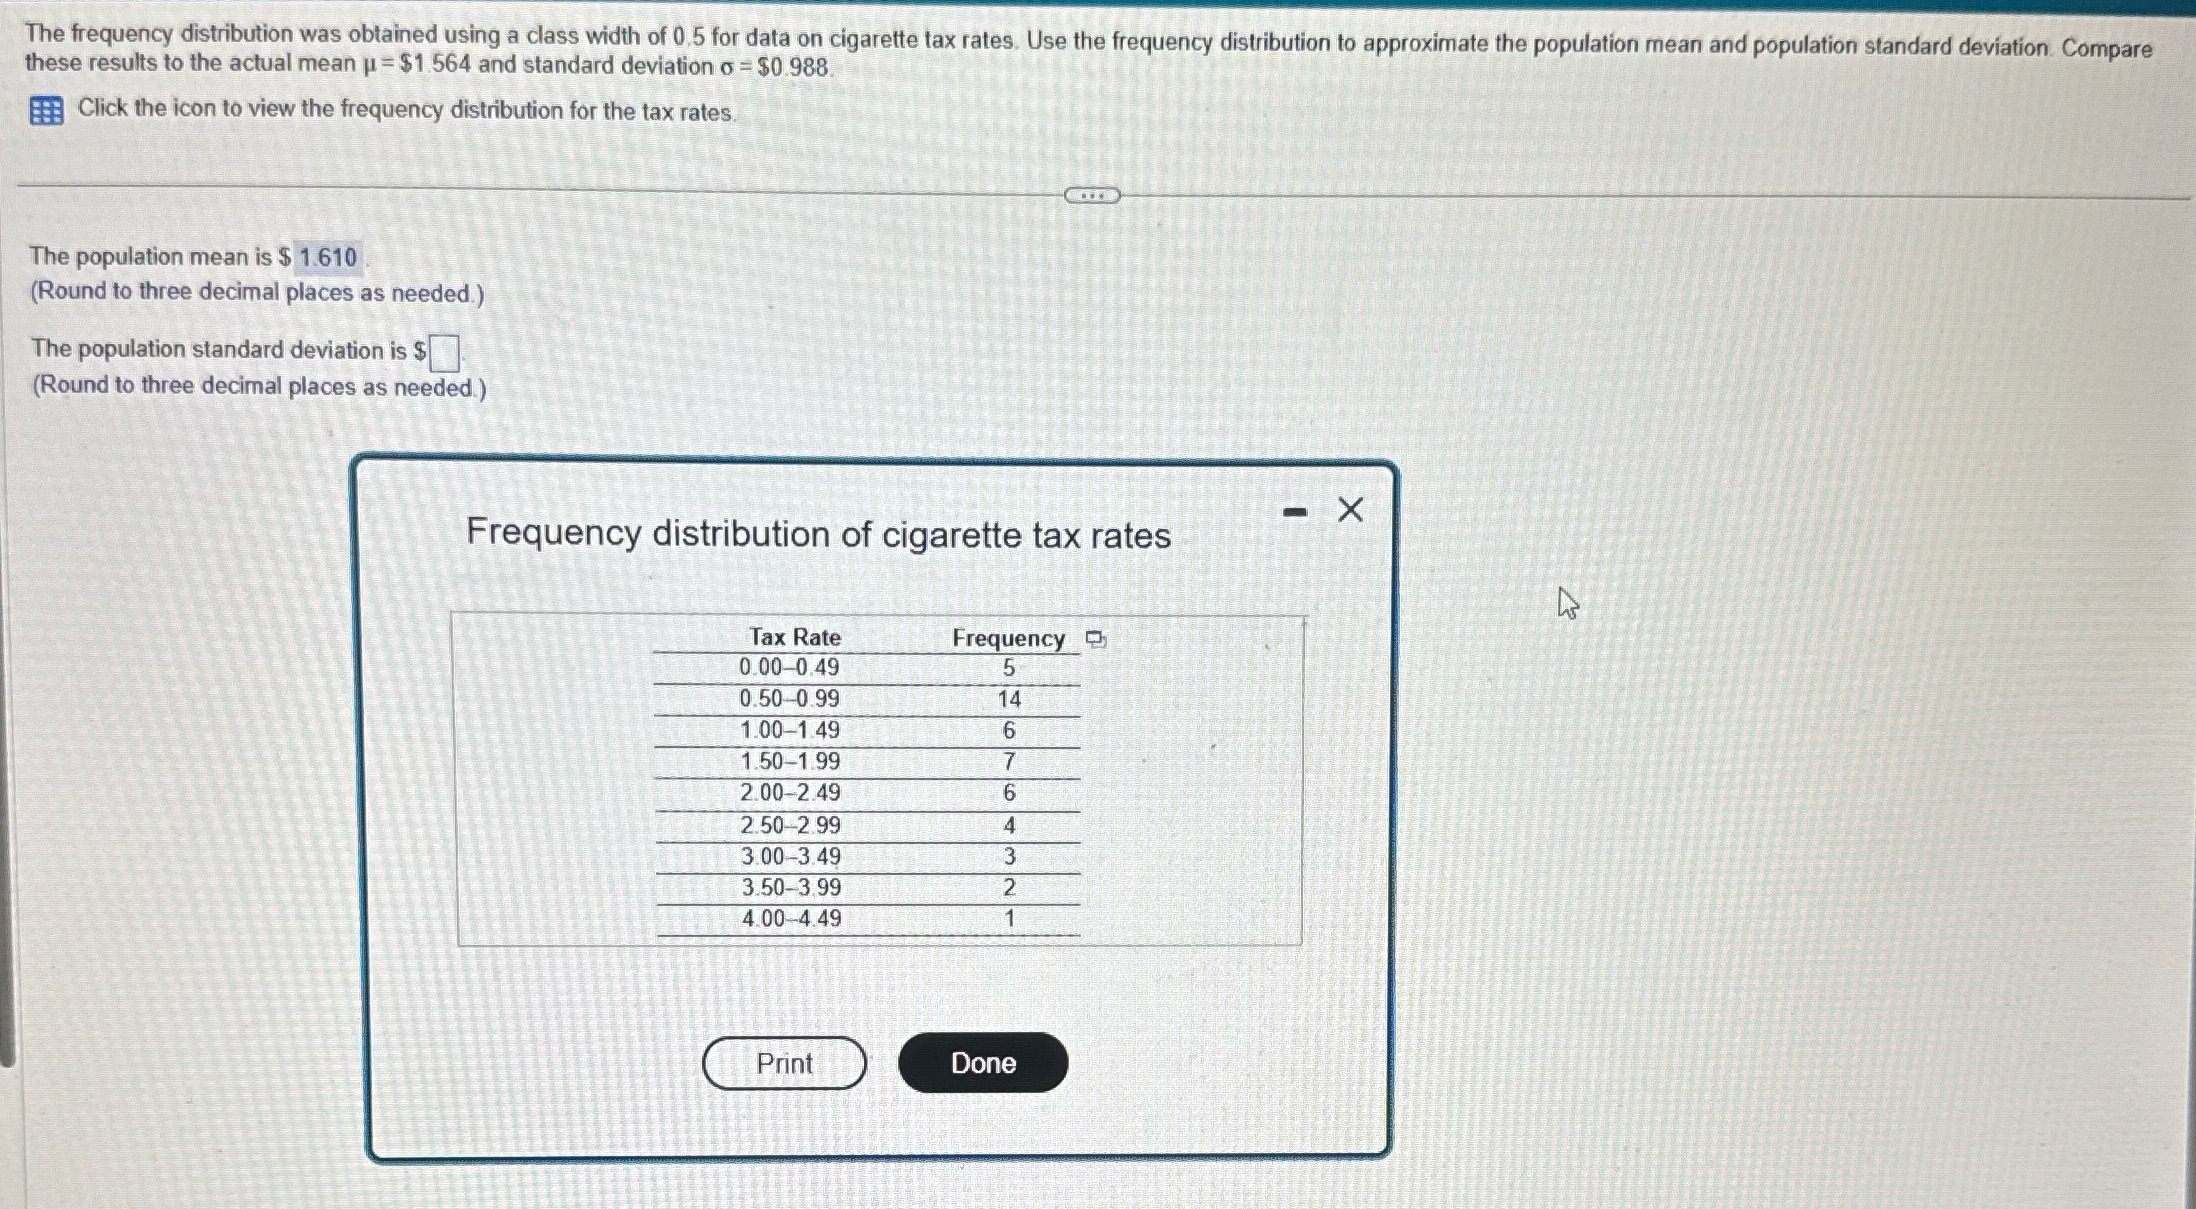
Question: I need help putting the population standard deviation, the first answer is correct. I just need the second part. The frequency distribution was obtained using

I need help putting the population standard deviation, the first answer is correct. I just need the second part.

I need help putting the population standard
The frequency distribution was obtained using a class width of 0.5 for data on cigarette tax rates. Use the frequency distribution to approximate the population mean and population standard deviation. Compare these results to the actual mean p = $1 564 and standard deviation o = $0.988. Click the icon to view the frequency distribution for the tax rates. The population mean is $ 1.610 (Round to three decimal places as needed.) The population standard deviation is $ (Round to three decimal places as needed.) X Frequency distribution of cigarette tax rates Tax Rate Frequency 2 0.00-0.49 5 0.50-0.99 14 1.00-1 49 6 1.50-1.99 2.00-2.49 6 2.50-2.99 3.00-3.49 3.50-3.99 4 00-4.49 Print Done

Step by Step Solution

There are 3 Steps involved in it

1 Expert Approved Answer
Step: 1 Unlock blur-text-image
Question Has Been Solved by an Expert!

Get step-by-step solutions from verified subject matter experts

Step: 2 Unlock
Step: 3 Unlock

Students Have Also Explored These Related Mathematics Questions!