

Question: i need help Select the correct answer. The value of a car, CQ, tyears after 2011, is modeled by the following function. (TO = 50,00010.9)
i need help
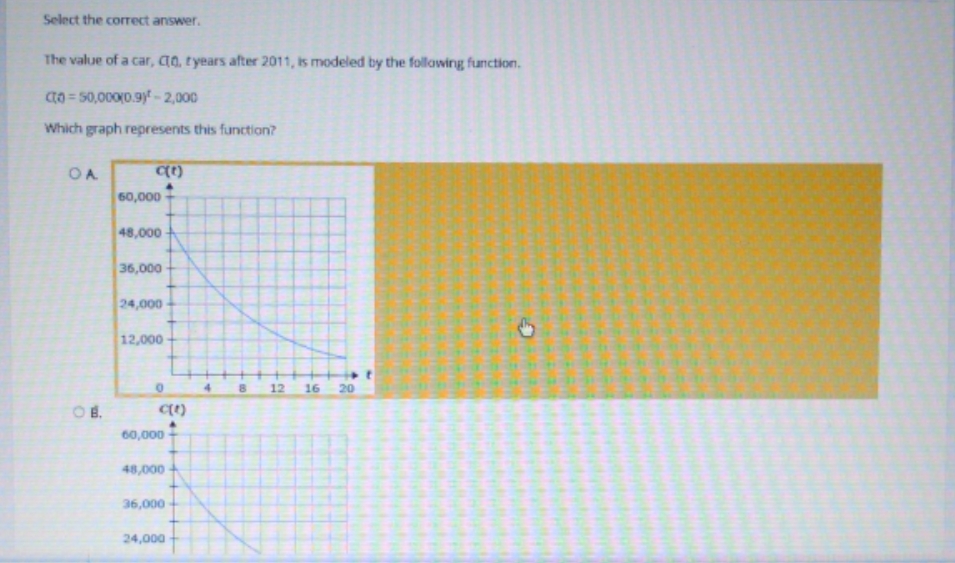
Select the correct answer. The value of a car, CQ, tyears after 2011, is modeled by the following function. (TO = 50,00010.9) - 2,000 Which graph represents this function? OA 60,000 48,000 36,000 24,000 12,000 0 B 12 16 20 OB. 60,000 48,000 36,000 24,000
Step by Step Solution
There are 3 Steps involved in it
1 Expert Approved Answer
Step: 1 Unlock

Question Has Been Solved by an Expert!
Get step-by-step solutions from verified subject matter experts
Step: 2 Unlock
Step: 3 Unlock