

Question: I need help solving the first blank in the first picture please. The following photos are additional information. The question is located in the photo

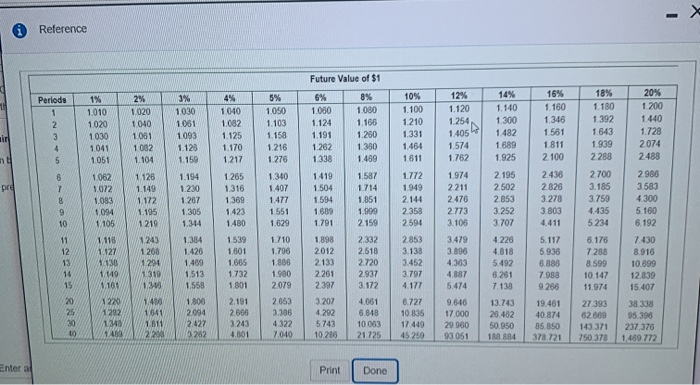
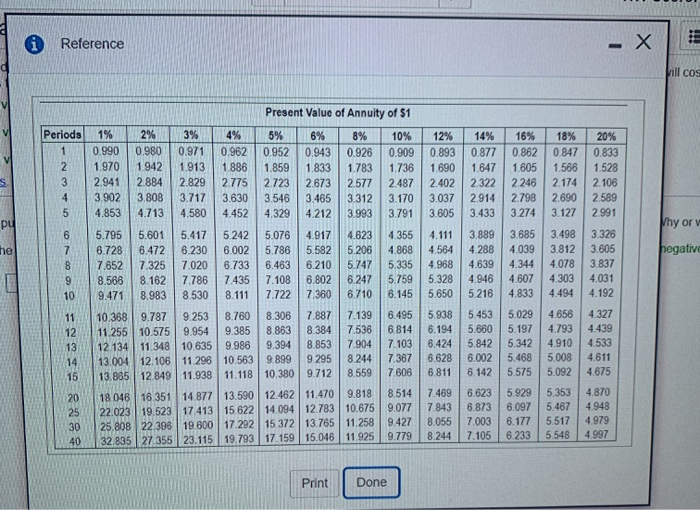
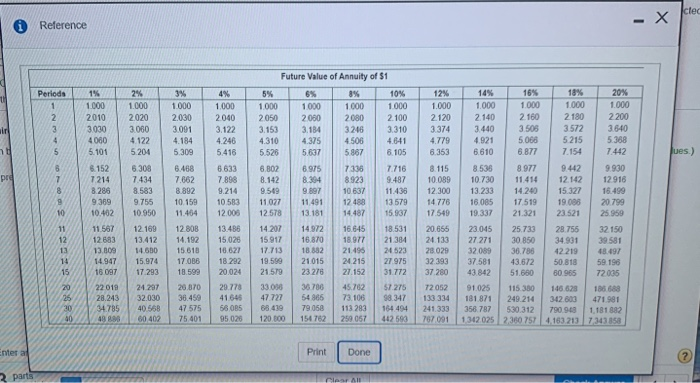
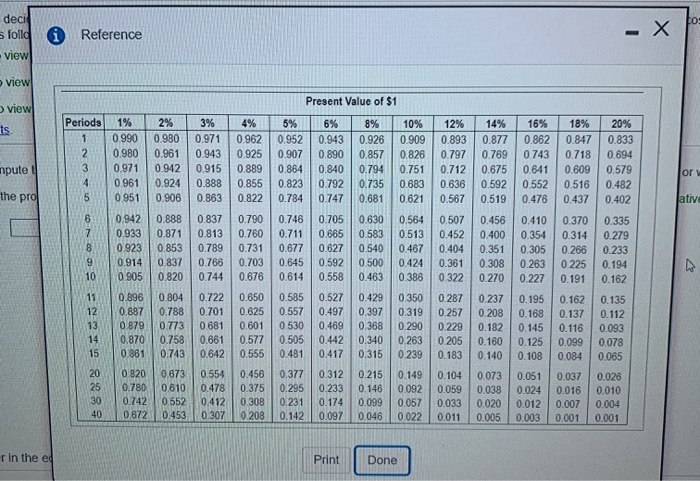
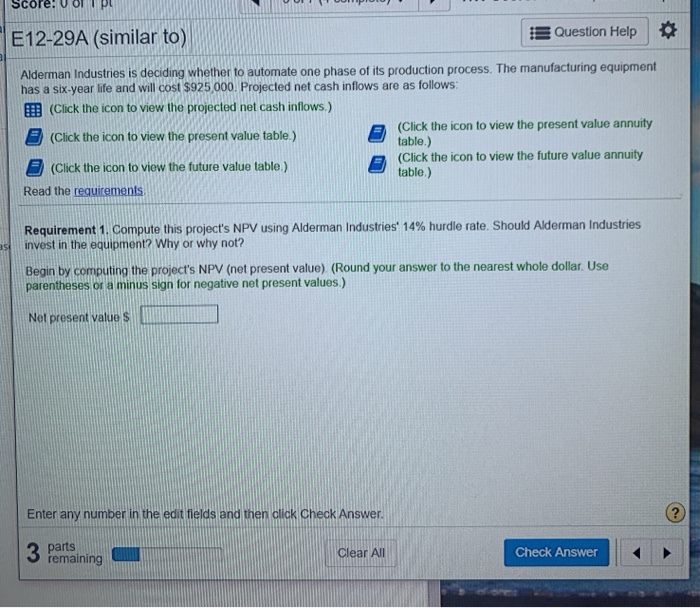
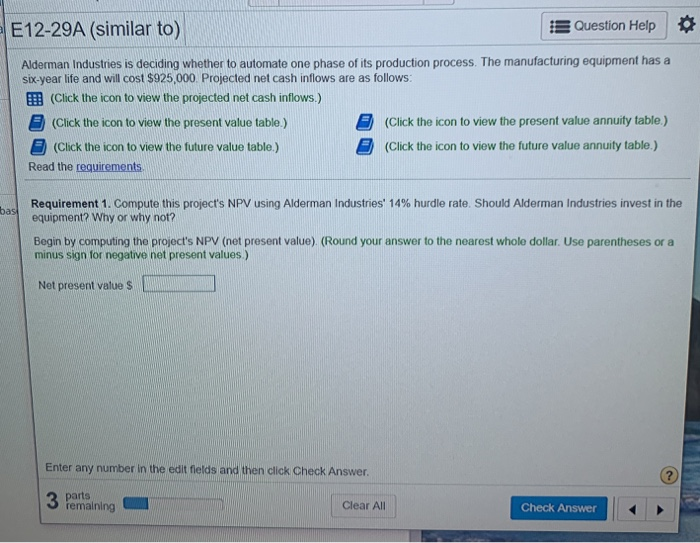
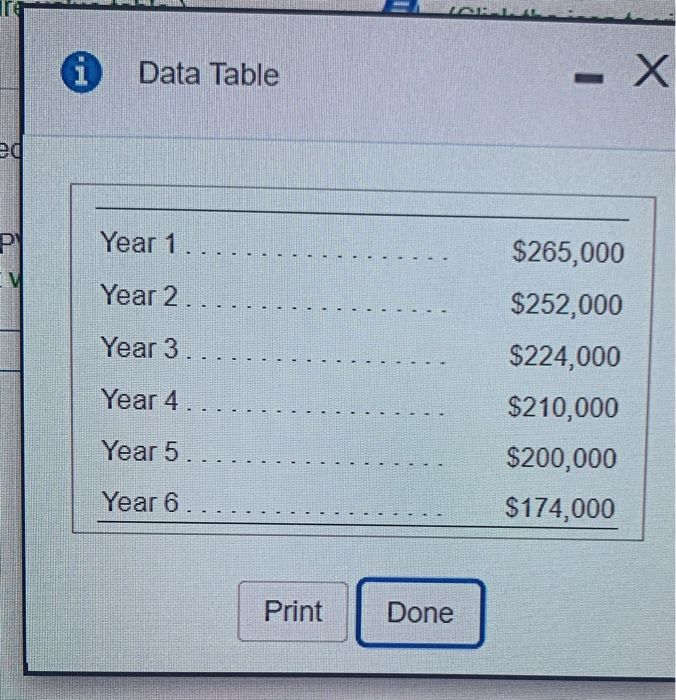
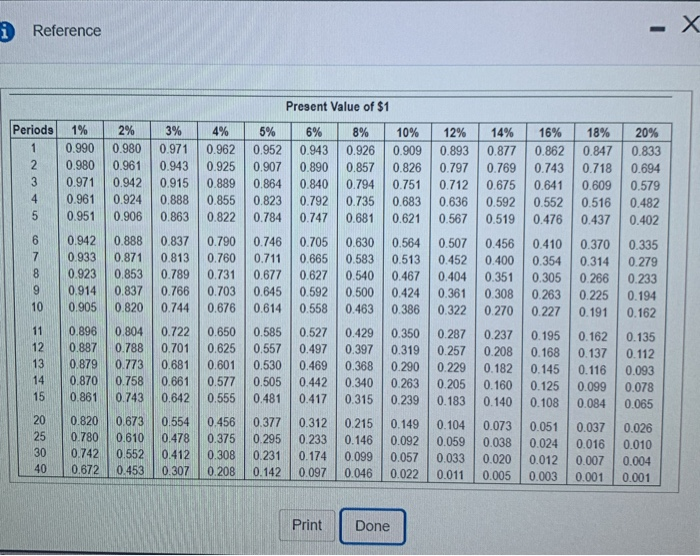
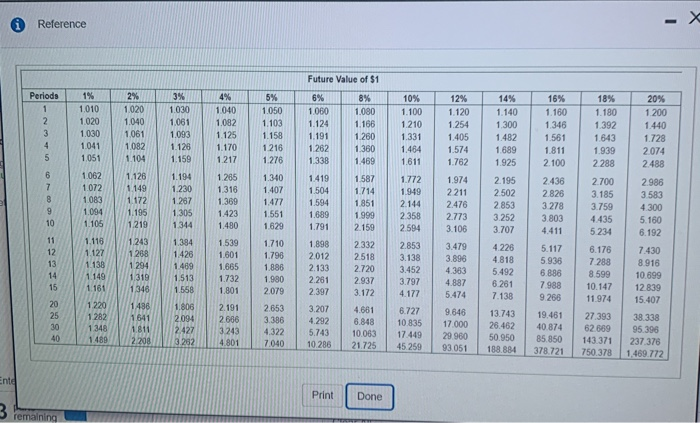
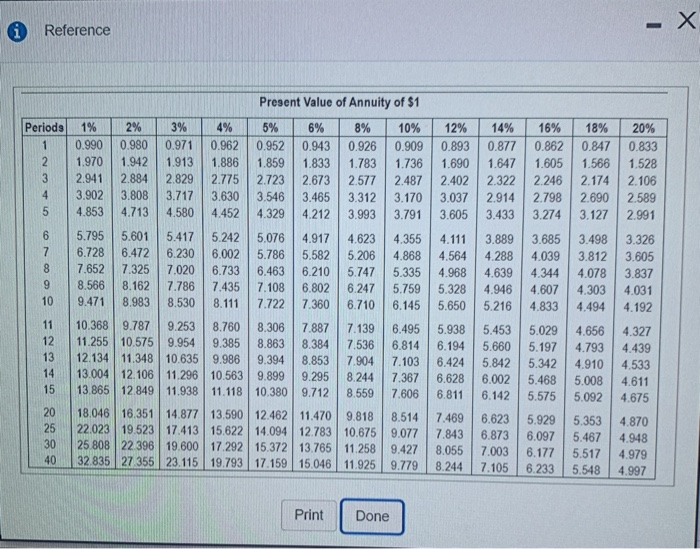
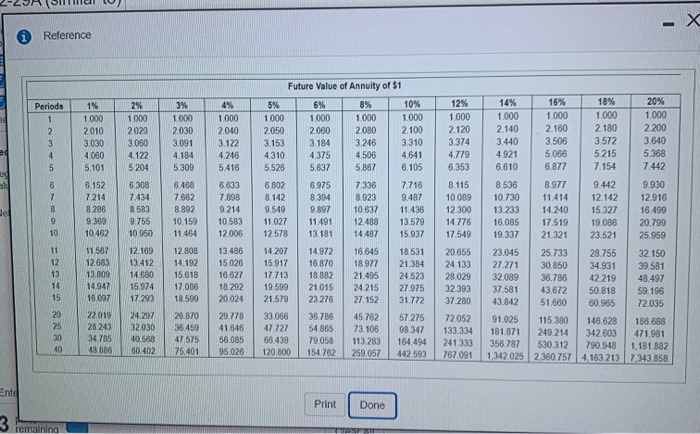
Reference Periods 1 5% 1050 1% 1.010 1.020 1030 1041 1020 1.061 1.093 1.125 1.159 1.103 1.158 1.216 1.276 Future Value of $1 5% 8% 1 080 1.080 1 124 1.166 1.191 1.260 1.262 1.350 1.338 1.469 4% 1010 1.082 1.125 1.170 1.217 1.265 1.316 1.369 1423 1.480 1051 2% 1.020 1040 1.061 1082 1.104 1.126 1.149 1.172 1.195 1219 1243 1062 - 1072 1.194 1.230 1 267 1.305 1.340 1.407 1.477 1551 1083 1419 1.504 1.594 1 689 1791 1.094 1/105 10% 1.100 1210 1.331 1.464 1.611 1.772 1.949 2144 2358 2.594 2.853 3.138 3.452 3.797 4.177 6.727 10.835 17 449 45259 12% 14% 1.120 1.140 1.254 1300 1405 1.482 1.574 1 689 1.762 1.925 1.974 2.195 2 211 2.502 2.478 2.853 2773 3.252 3.106 3.707 3.479 4.226 3.896 4.818 4.363 5.492 4.887 8.251 5,474 7.138 9646 13.743 17.000 26.462 29 960 50.950 93 051188 884 16% 18% 1.160 1.180 1.346 1 392 1561 1.643 1 811 1.939 2100 2288 2.436 2700 2826 3.185 3.278 3.759 3.803 4.435 4.411 5234 5.117 6.176 5.936 7.288 6.888 8.599 7983 10.147 9.266 11 974 19.461 27.393 40.874 62.689 35850 143.371 378.721750 378 20% 1.200 1.440 1.728 2074 2488 2986 3.583 4.300 5.160 6.192 7.430 8.916 10.699 12.839 15 407 38.338 95 396 237376 1.469 772 1.314 1 629 1.539 ODE 8 1208 1801 1.587 1.714 1.851 1.999 2.159 2.332 2.518 2.720 2937 3.172 4.661 6.848 10 063 21725 1.118 1.127 1.138 1.149 1384 1.426 1.469 1.513 1.558 1.291 1319 1305 1.665 1.732 1801 1.710 1.796 1.886 1.980 2.079 2653 3.386 4322 7 010 101 1.898 2012 2133 2261 2.397 3.207 4292 5.743 10.208 1436 2.191 2605 1292 1.800 2094 1641 1348 2027 R 1.811 22 1243 4.801 Enter al Print Done Reference X will cos Periods 3% VI Dow Why or negativ he Present Value of Annuity of $1 1% 2% | 4% 5% 8% 10% 12% 14% 16% 18% 0.990 0.980 0.971 0.9620.952 0.943 0.926 0.9090.893 0.877 0.862 0.847 0.833 1.970 1942 1.913 1886 1.859 1.833 1.783 1736 1.6901.647 1.605 1.566 1.528 2.941 | 2.884 2.829 2.775 2.723 2.673 2577 2.487 2.402 2.322 2246 2.174 2.106 3.902 3.808 3.7173.630 3.546 3.465 3.312 3.170 3.037 2.914 | 2.798 2.690 2 589 4.853 4.7134.580 4.452 4.329 4.212 3.993 3.791 3.605 3.433 3.274 3.1272.991 5.795 5.601 5.417 5.2425.076 4.917 4.623 4.355 4.111 3.889 3.685 3.498 3.326 6.728 6.472 6.2306.0025.786 5.5825.206 4.868 4,564 4.288 4.039 3.812 3.605 7.652 7.325 7,020 6.7336.463 6.210 5.747 5.335 4.9684.639 4.344 4.078 3.837 8.566 8.162 7.786 7.435 7.108 6.8026.247 5.759 5.328 4.946 4 6074 303 4.031 9.471 8.9838.530 8.1117.722 7.360 6.710 6.145 5.6505.216 4.833 4.494 4.192 10 368 9.787 9.2538.760 8.3067.887 7.139 6.495 5.938 5.4535.029 4.656 4.327 11.255 10.575 9.954 9.385 8.863 8.384 7.536 6.814 6.194 5.660 5.197 4.793 4.439 12.134 11.348 10 635 9.986 9.394 8.853 7.904 7.103 6.424 5.842 5.342 4910 4.533 13.004 12.106 11 296 10.563 9.899 9 295 8.244 7.3676.6286.002 5.468 5.008 4611 13.885 12.849 11.938 11.118 10.380 9.7128.559 7.606 6.811 6.142 5.575 5.092 4.675 18 046 16351 14.877 13.590 12.462 11.470 9.818 8.514 7.4696.623 5.929 5.353 4.870 22.023 19.523 17 413 15 622 14.094 12783 10.675 9.0777 843 6.873 6.097 5.467 4.948 25.808 22 395 19 600 17.292 15 372 13.765 11.258 9.4278.0557.003 6.177 5.517 4979 32.835 27 356 23.115 19.793 17 159 15.046 11.925 9.779 | 8.244 4997 7.1056 233 5548 USG Print Done Actec - X Reference Periods 5% 1000 4% 1.000 2040 3.122 4246 5.416 3.640 4506 6.633 7.898 9214 1% 1 000 2010 3030 4060 5.101 6.152 7.214 8.286 9369 10.402 11 567 12883 13.809 14.947 15 097 22 019 28.243 34.785 48 8. 8 2% 3% 1.000 1000 2020 2.030 3060 1091 4.122 4184 5 204 5.309 6,308 6.458 7434 7.662 8.583 8.892 9.755 10 159 10950 11.454 12.169 12 OR 13.412 14.192 14.680 15 618 15.974 17.0BB 17.293 18.599 2420720.870 32.030 38459 40.568 47575 00 402 75 401 10 503 12.005 Future Value of Annuity of $1 10% 12% 14% 16% 18% 20% 1000 1000 1000 1000 1.000 1.000 1.000 1000 2050 2080 2080 2.100 2120 2140 2 160 2180 2200 3.153 3.184 3246 3310 3374 3.440 3.505 3.572 4.310 4.375 4641 4.779 4.921 5.068 5215 5.368 5.526 5.637 5.867 6.105 6.363 6.610 6.877 7.154 7.442 6.B02 6.975 7336 7.716 8 115 8.535 8.977 9.442 9.930 8.142 8.923 9.487 10.089 10.730 11.414 12.142 12 918 9549 897 10.637 11.436 12.300 13.233 14.240 15.327 16.499 11 027 11.491 13 579 14776 16085 17 519 1900 20 799 12.578 13.181 15.937 17 549 19.337 21.321 23 521 25 959 14.207 14.972 16 645 18.531 20.656 23.045 25.733 28.755 32 150 15 917 18 870 18.977 21384 20.133 27.271 30 950 34.931 39.581 17 713 18 292 21.496 24523 28 029 32 089 36 786 42219 48 497 19.599 21 015 24215 27.975 32 193 37581 43 572 50 818 59.196 21.579 23 276 27.152 37.280 43.842 51.660 80 965 72035 33 038 2706 45782 $7.275 72052 91.025 115 380 140 628 186 688 47.727 54 865 73.106 98.347 113 334 181 871 249.214 342.603 471 991 88.419 79 058 113 283 164 494 241 333 356.787 $30 312 790 90 | 1181882 154 72 250 067 412 5907670911 342 0252360 757 4.163 213 7343358 13.486 15.024 18.627 18.282 20.024 20 778 41 645 58 085 95028 31.12 Enter all Print Done 2 parts deci follo Reference view view view mpute the pro Present Value of $1 Periods 1% 2% 3% 4% 5% 6% 8% 10% 12% 14% 16% 18% 20% 0.990 0.980 0.971 0.962 0.952 0.943 0.926 0.909 0.893 0.877 0.862 0.847 0.833 2 0.980 0.961 0.943 0.925 0.907 0.890 0.8570.826 0.797 0.769 0.7430.7180.694 0.971 0.942 0.915 0.8890.864 0.840 0.794 0.751 0.712 0.675 0.641 0.609 0.579 4 0.9610.9240.888 0.855 0.823 0.792 0.735 0.683 0.636 0.592 0.552 0.516 0.482 0.951 0.9060,863 0.822 0.784 0.747 0.681 0.621 0.567 0.5190.476 0.437 0.402 0.942 0.888 0.837 0.790 0.746 0.705 0.630 0.564 0.507 0.456 0.410 0.370 0.335 7 | 0.933 0.871 0.813 0.7600.7110.665 0.583 0.513 0.452 0.400 0.354 0.314 0.279 0.923 0.853 0.789 0.731 0.677 0.6270.540 0.467 0.404 0.351 0.305 0.266 0.233 0.914 0.837 0.766 0.703 0.6450.5920 500 0.424 0.361 0.308 0.2630 225 0.194 0.905 0.820 0.744 0.676 0.614 0.558 0.463 0.386 0.322 0.270 0.227 0.191 0.162 0.896 0.8040.722 0.650 0.585 0.527 0.429 0 350 0.287 0.237 0.1950.162 0.135 12 0.887 0.788 0.701 0.625 0.557 0.497 0.397 0.319 0.257 0.208 0.168 0.137 0.112 13 0.879 0.773 0681 0.601 0.530 0.469 0.368 0.290 0.229 0.182 0.145 0.116 0.093 0.870 0.758 0.661 0.577 0.505 0.442 0.340 0.263 0.205 0.160 0.125 0.099 0.078 0 861 0.743 0.642 0.555 0.481 0.417 0.315 0.2390.183 0.140 0.108 0.084 0.065 0 820 0.673 0.554 0.456 0.377 0.312 0.215 0.149 0.104 0.073 0.051 0.037 0.026 0.780 0.610 0.478 0.375 0.295 0.233 0.146 0.092 0.0590.038 0.024 0.0160.010 0.7420 552 0.412 0.308 0.231 0.174 0.099 0.057 0.033 0.0200.012 0.007 0.004 40 0.672 0.453 0.30702080.1420.097 0.046 0.022 0.011 0.005 0.003 0.001 0.001 r in the e Print Done SCUI. U ULIL on- E12-29A (similar to) Question Help Alderman Industries is deciding whether to automate one phase of its production process. The manufacturing equipment has a six-year life and will cost $925,000. Projected net cash inflows are as follows: (Click the icon to view the projected net cash inflows) 3 (Click the icon to view the present value table.) (Click the icon to view the present value annuity table.) (Click the icon to view the future value table) (Click the icon to view the future value annuity table.) Read the requirements Requirement 1. Compute this project's NPV using Alderman Industries' 14% hurdle rate. Should Alderman Industries invest in the equipment? Why or why not? Begin by computing the project's NPV (net present value) (Round your answer to the nearest whole dollar. Use parentheses or a minus sign for negative not present values.) Net present values Enter any number in the edit fields and then click Check Answer. 3 parts 3 remaining Clear All Check Answer E12-29A (similar to) is Question Help Alderman Industries is deciding whether to automate one phase of its production process. The manufacturing equipment has a Six-year life and will cost $925,000 Projected net cash inflows are as follows: (Click the icon to view the projected net cash inflows.) (Click the icon to view the present value table.) (Click the icon to view the present value annuity table.) (Click the icon to view the future value table.) (Click the icon to view the future value annuity table.) Read the requirements Requirement 1. Compute this project's NPV using Alderman Industries' 14% hurdle rate. Should Alderman Industries invest in the equipment? Why or why not? Begin by computing the project's NPV (net present value) (Round your answer to the nearest whole dollar. Use parentheses or a minus sign for negative net present values ) Net present value S Enter any number in the edit fields and then click Check Answer 3 parts 5 remaining Clear All Check Answer * Data Table - - - - Year 1.. Year 2. Year 3. Year 4. Year 5.. $265,000 $252,000 $224,000 $210,000 $200,000 $174,000 Year 6. Print Print Done i Reference Periods 1% 2% 3% 0.990 0.980 0.971 0.980 0.961 0.943 0.971 0.942 0.915 0.961 0.924 0.888 0.951 0.906 0.863 0.942 0.888 | 0.837 0.933 0.871 0.813 0.923 0.853 0.789 0.914 0.837 0.766 0.905 0.820 0744 0.896 0.804 0.722 0 .887 0.788 0.701 0.879 0.773 0.681 0.8700.758 0.661 0.861 0.743 0.642 0.820 0.673 0.554 0.780 0.610 0.478 0.742 0.552 0.412 0.672 0.453 0.307 Present Value of $1 4% 5% 6% 8% 10% 0.962 0.952 0.943 0.926 0.909 0.925 0.907 0.890 0.857 0.826 0.8890.864 0.840 0.794 0.751 0.855 0.823 0.792 0.735 0.683 0.822 0.784 0.747 0.681 0.621 0.790 0.746 0.705 0.630 0.564 0.760 0.711 0.665 0.583 0.513 0.731 0.677 0.627 0.540 0.467 0.703 0.6450.592 0.500 0.424 0.676 0.614 0.558 0.463 0.386 0.650 0.585 0.527 0.429 0.350 0.625 0.557 0.497 0.397 0.319 0.601 0.530 0.469 0.368 0.290 0.577 0.505 0.442 0.340 0.263 0.556 0.481 0.417 0.315 0.239 0.456 0.377 0.312 0.215 0.149 0.375 0.295 0.233 0.146 0.092 0.308 0.231 0.174 0.099 0.057 0.208 0.142 0.097 0.046 0.022 10 12% 14% 16% 0.893 0.877 0.862 0.797 0.769 0.743 0.712 0.675 0.641 0.636 0.592 0.552 0.567 0.519 0.476 0.507 0.456 0.410 0.452 0.400 0.354 0.4040.3510.305 0.361 0.308 0.263 0.322 0.270 0.227 0.287 0.237 0.195 0.257 0.208 0.168 0.229 0.182 0.145 0.205 0.160 0.125 0.183 0.140 0.108 0.104 0.073 0.051 0.059 0.038 0.024 0.033 0.020 0.012 0.0110.005 0.003 18% 20% 0.847 0.833 0.7180.694 0.609 0.579 0.516 0.482 0.437 0.402 0.370 0.335 0.314 0.279 0.266 0.233 0.225 0.194 0.191 0.162 0.162 0.135 0.137 0.112 0.116 0.093 0.099 0.078 0.084 0.065 0.037 0.026 0.0160.010 0.007 0.004 0.001 0.001 12 15 Print Done Reference Future Value of $1 25 10% 19% 1.080 1010 1020 1.030 1.041 1.020 1.040 1,061 1.082 1.104 1030 1051 1.093 10.00 1.082 1.125 1.170 1.217 5% 1050 1. 103 1.158 1.216 1.276 1050 1.124 1.191 1 262 1338 1 200 1.440 1.728 2074 1.126 1159 1051 2488 1.062 1.072 1083 1.004 1.125 1.149 1.172 1.194 1.230 1287 1 265 1 315 1.369 1.423 1.430 1.340 1.407 1.477 1.551 1629 1419 1504 1.594 1,699 1.791 1.195 1.180 1.392 1.643 1939 2288 2700 3.185 3.759 4.435 5234 6.175 7.288 8.599 10.147 11 974 105 1219 1.166 1.260 1.360 1.469 1.587 1714 1851 1 999 2 159 2332 2518 2.720 2.937 3.172 4.661 6.848 10.063 21.725 1305 1344 12% 14% 16% 1.100 1. 120 1.140 1.160 1.210 1.254 1.300 1.346 1 331 1.405 1482 1.561 1.464 1574 1.689 1.811 1.611 1.762 1.925 2.100 1772 1.974 2.195 2436 1.949 2211 2502 2826 2.144 2.476 2853 3 278 2358 2.773 3.252 3.803 2594 3.106 3.707 4.411 2853 3.479 4226 5.117 3.138 3.896 4.818 5 935 3.452 4383 5.492 6 886 3.797 4.887 6.261 7.988 4.177 5.474 7.138 9266 6.727 9.648 13.743 1 9.451 10 835 17 000 28.452 40.874 17.449 29.960 50.950 85.850 4525993 051188.884378.721 1 243 1384 1539 1.601 1258 1426 1294 1.319 1409 1513 1558 1665 1732 1.710 1.798 1.888 1.980 2079 2986 3.583 4300 5.160 6.192 7.430 8.916 10.699 12839 15.407 38.338 95 396 237.378 1.469772 1.898 2012 2.133 2.281 2.397 3207 4292 5.743 1.801 1220 1108 1202 2.191 2656 3.243 4801 2653 3.386 4.322 1348 1489 27.393 62 669 143.371 750,378 2208 Print Done Reference Periods Present Value of Annuity of $1 1% 2% 3% 4% 5% 6% 8% 10% 12% 14% 16% 18% 20% 0.990 0.980 0.971 0.962 0.952 0.943 0.926 0.909 0.893 0.877 0.862 0.847 0.833 1.970 1.942 1.913 1.886 1.859 1.833 1.783 1.736 1.690 1.647 1.605 1.566 1.528 2.9412.884 2.829 2.775 2.723 2.673 2.577 2.487 2.402 2.322 2.246 2.174 2.106 3.902 3.808 3.717 3.630 3.546 3.465 3.312 3.170 3.037 2.914 2.798 2.690 2.589 4.853 4.713 4.580 4.452 4.329 4.212 3.993 3.791 3.605 3.433 3.274 3.127 2.991 6.795 5.601 5.417 5.242 5.076 4.917 4.623 4.355 4.111 3.889 3.685 3.498 3.326 6.728 6.472 6.230 6.002 5.786 5,582 5.206 4.868 4,564 4.288 4.039 3.812 3.605 7.652 7.325 7.0206.733 6.4636.210 5.7475.335 4.968 4.639 4.344 4.0783.837 8.566 8.1627.786 7.435 7.108 6.802 6.247 5.759 5.328 | 4.9464.607 4.303 4.031 9.471 8.983 8.530 8.111 7.722 7.360 6.710 6.145 5.650 5.216 4.833 4.494 4.192 10.368 9.787 9.2538.760 8.306 7.887 7.139 6.495 5.938 5.453 5.029 4.656 4.327 11.255 10,575 9.954 9.385 8.863 8.384 7.536 6.814 6.194 5.660 5.1974.793 4.439 12.134 11.348 10.635 9.986 9.3948.853 7.904 7.103 6.424 5.842 5.342 4.910 4.533 13.004 12.106 11.296 10.563 9.899 9.295 8.2447.367 6.628 6.002 5.468 5.008 4.611 13.865 12 849 11.938 11.118 10.380 9.712 8.559 7.606 6.811 6.142 5.575 5.092 4.675 18.046 16.351 14.877 13,590 12.462 11.470 9.818 8.514 7.469 6.623 5.929 5.353 4.870 22.023 19.523 17.41315.622 14.094 12.783 10.675 9.077 7.843 6.873 6.097 5.467 4.948 25 808 22 396 19.600 17.292 15.372 13.765 11.258 9.4278.055 7.003 6.177 5.517 4.979 32 835 27.355 23.115 19.793 17.159 15.046 11.925 9.7798.244 7.105 6.233 5.548 4.997 Print Done 2-20H SI U Reference 4% 1 000 2040 3.122 4246 5.416 6.633 7,898 9.214 10.583 1% 2% 1.000 1.000 2010 2020 3.030 3.050 4.060 4.122 5.101 5.204 6.152 6308 7.214 7434 8.286 8.583 9.389 9.755 10462 10.950 11.567 12.169 12683 13.412 13.809 14.680 14.947 15.974 16.09717293 22.019 24.297 28.243 32.030 34.785 40 588 48.88680.402 3% 1 000 2030 3.091 4.184 5.309 6.468 7682 8.892 10.159 11.464 12.808 14.192 15.618 17.085 18599 26.870 36.459 47.575 75.401 Future Value of Annuity of $1 5% 6% 8% 10% 1000 1.000 1.000 1.000 2050 2.060 2.080 2.100 3.153 3.184 3.246 3.310 4.310 4.375 4,506 4.641 5.526 5.637 5.887 6.105 6.802 6.975 7.336 7.716 8.142 8.394 8.923 9.487 9.549 9.897 10.637 11.436 11.027 11491 12.488 13.579 12 578 13.181 14.487 15.937 14207 14.972 16.645 18.531 15.917 16 870 18.977 21.384 17 713 18 882 21.495 24.523 19.599 21015 24 215 27.975 21.579 23276 27.152 31772 33.066 38 786 45.762 57.275 47.727 54.865 73.108 98.347 68.439 79.058 113.283 164.494 120 800 154.762 259.057 442 593 12 006 12% 1.000 2.120 3.374 4.779 6.353 8.115 10.089 12 300 14 776 17.549 20.655 24.133 28 029 32.393 37 280 72052 133.334 241.333 767 091 14% 1.000 2.140 3.440 4.921 6.610 8.536 10.730 13.233 16.085 19.337 23045 27.271 32089 37581 43.842 91.025 181871 356.787 1,342 025 16% 18% 20% 1.000 1.000 1.000 2.160 2.180 2200 3.506 3.572 3.640 5.066 5.215 5.368 6.877 7.154 7.442 8.977 9.442 9.930 11.414 12.142 12.916 14.240 15 327 16.499 17 519 19.086 20.799 21.321 23.521 25.959 25.733 28.755 32.150 30.850 34.931 39.581 36.786 42 219 48.497 43.672 50.818 59.196 51.660 60.965 72.035 115 380 146.628 188.688 249.214 342.603 471.981 530312790.948 1.181 882 2.360.757 4 163 213 7343.858 13.486 15.026 16.627 18.292 20.024 29.778 41 546 56.085 95.026 Ente Print [Done] 3 remaining
Step by Step Solution
There are 3 Steps involved in it
To compute the Net Present Value NPV for Alderman Industries project using a 14 hurdle rate follow t... View full answer

Get step-by-step solutions from verified subject matter experts