

Question: I need help solving the highlighted sections. Please include the formula and steps. ASSUMPTIONS NOTE: You will use a combination of Proforma, Ratios, and the
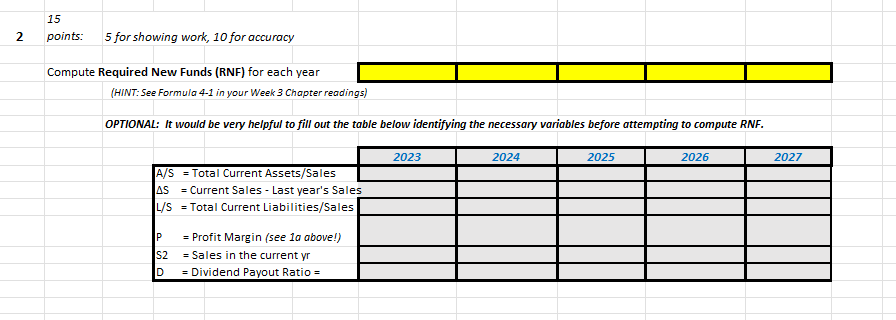
I need help solving the highlighted sections. Please include the formula and steps.
| ASSUMPTIONS | ||||||||||
| NOTE: You will use a combination of Proforma, Ratios, and the Percent-of-Sales methods to create your forecasted financials. | ||||||||||
| 1 | The Sharks gave you the $1,000,000 in funding you requested in exchange for 25% ownership of your company's profits. | |||||||||
| 2 | All the following are complete by March 31, 2023: 1) your shark funding has been received, 2) new capital investments have been purchased and set up, and 3) additional labor has been hired and trained. | |||||||||
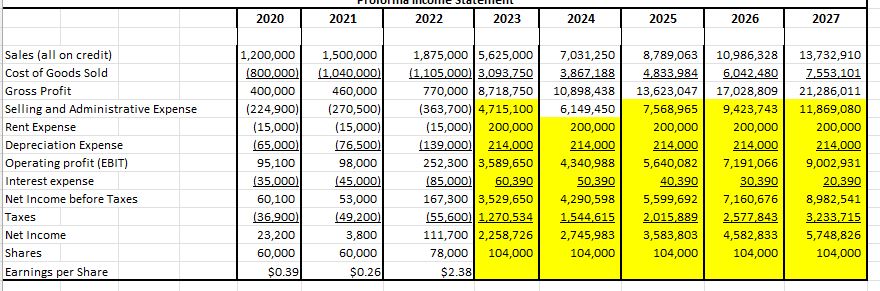
| 3 | SELLING & ADMINISTRATIVE EXPENSE: Use a3-year average Percent-of-Sales to forecast S&A expenses. (HINT: Find what percent S&A expense is for each of 2020, 2021, and 2022, and average the 3 results together. Use the resulting average S&A Percent-of-Sales to forecast S&A into the future.) | |||||||||
| 4 | RENT EXPENSE:Rent expense is a fixed cost in the amount of $15,000 per year in 2020-2022, increasing to $200,000 per year in 2023. | |||||||||
| 5 | DEPRECIATION EXPENSE:Depreciation expense is a fixed cost in the amount of 10% of Plant & Equipment each year. | |||||||||
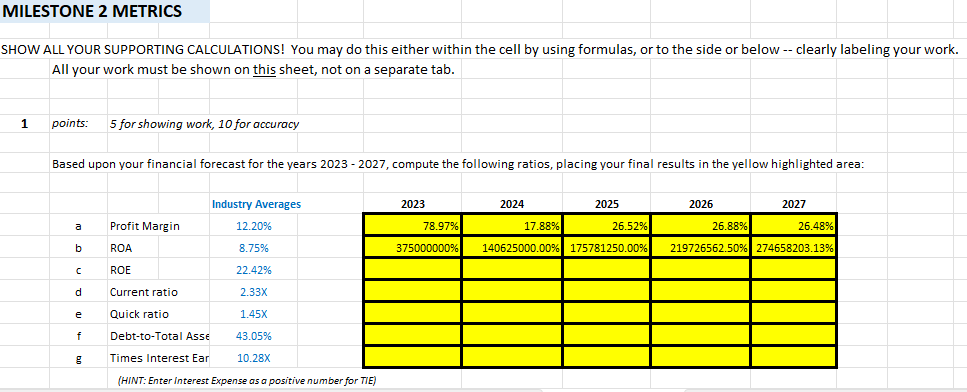
| 6 | INTEREST EXPENSE: This is a Fixed cost, and is 10% of Long-term Liabilities. | |||||||||
| 7 | TAXES:Because you live in a business-friendly State (Wyoming), you don't have to pay state taxes on your LLC's income. You do, however, still have to pay Federal taxes. Also, in 2022, higher tax rates were passed for the 2023 tax year, pushing income over $400,000 into the 39.6% tax bracket. Because of this, use36% as your effective tax rate. (NOTE: If the taxes shown for 2020-2022 seem high, it's because you had income from another job that threw your LLC income into a slightly higher tax bracket. However, you'll quit that job IF the sharks fund you!) | |||||||||
| 8 | SHARES:Issued 26,000 $1-par shares to the sharks for a 25% ownership stake. | |||||||||
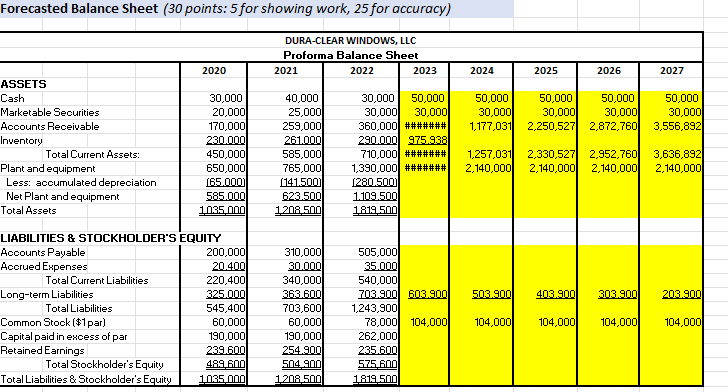
| 9 | CASH:Increases to $50,000 in 2023 and stays at that level. | |||||||||
| 10 | MARKETABLE SECURITIES:Plan to keep Marketable Securities at 60% of Cash levels. | |||||||||
| 11 | ACCOUNTS RECEIVABLE:Use a 3-year average Receivables Turnover ratio to forecast.(HINT: Find the formula for Receivables Turnover (RTO) in your Week 2 Chapter readings, and solve for RTO for each of 2020, 2021, and 2022. Average the 3 results together. Plug your Average RTO into the RTO formula for each future year, along with your other known number from your financial statements, to find your forecasted Accounts Receivable amounts. This is demonstrated in your Week 2 Lesson!) | |||||||||
| 12 | INVENTORY: Compute a 3-year average of inventory as a Percent-of-Sales, and then use that figure to forecast inventory levels through 2027. | |||||||||
| 13 | PLANT & EQUIPMENT: There is a new capital expenditure of $750,000 dollars in 2023, paid for from the $1M in funding from the sharks, rather than with new debt. (All capital expenditures are assumed to occur on January 1st of the year of purchase, and no equipment is sold or salvaged during the forecasted period.) | |||||||||
| 14 | ACCUMULATED DEPRECIATION:Each year, 10% of the total amount ofPlant and Equipmentis added to the depreciation amount. | |||||||||
| 15 | ACCOUNTS PAYABLE:Use the 3-year average Current Ratio to forecast.(HINT: The Current Ratio will help you forecast TOTAL Current Liabilities, not Accounts Payable. Find Total Current Liabilities and Accrued Expenses first, and then you can solve for Accounts Payable.) | |||||||||
| 16 | ACCRUED EXPENSES:Use the 3-year average Percent-of-Sales method to forecast. | |||||||||
| 17 | LONG-TERM LIABILITIES: Pay down $100,000 of old debt every year starting in 2023. | |||||||||
| 18 | COMMON STOCK ($1 Par): Increase by the dollar value of shares issued to sharks (26,000 shares at $1 par). | |||||||||
| 19 | CAPITAL PAID IN EXCESS OF PAR: The shark's full investment of $1M must be reflected on the Balance Sheet. The stock received by the shark, worth $26,000 (at Par value of $1 per share), is already reflected under Common Stock. The rest of the shark's investment value is added to this account. | |||||||||
| 20 | RETAINED EARNINGS: This amount is whatever it takes to make the Balance Sheet balance! (HINT: Remember Total Liabilities + Stockholder's Equity is equal to Total Assets. Once Total L + SE is determined, Total SE can be solved. Finally, once Total SE is solved, Retained Earnings can be solved.) | |||||||||
| 21 | DIVIDENDS: You do not pay dividends now and do not plan to while in a growth stage. |
Step by Step Solution
There are 3 Steps involved in it
1 Expert Approved Answer
Step: 1 Unlock

Question Has Been Solved by an Expert!
Get step-by-step solutions from verified subject matter experts
Step: 2 Unlock
Step: 3 Unlock