

Question: i need help solving these different types of ratios with the given information sos (: Asset Management Rations Total Assets Turnover Ratio Fixed Assets Turnover

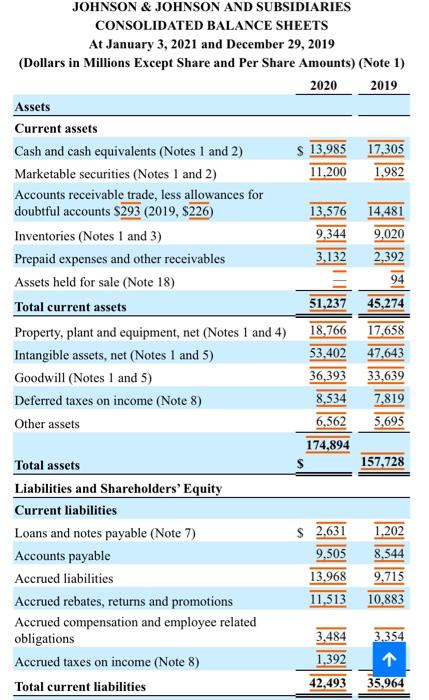
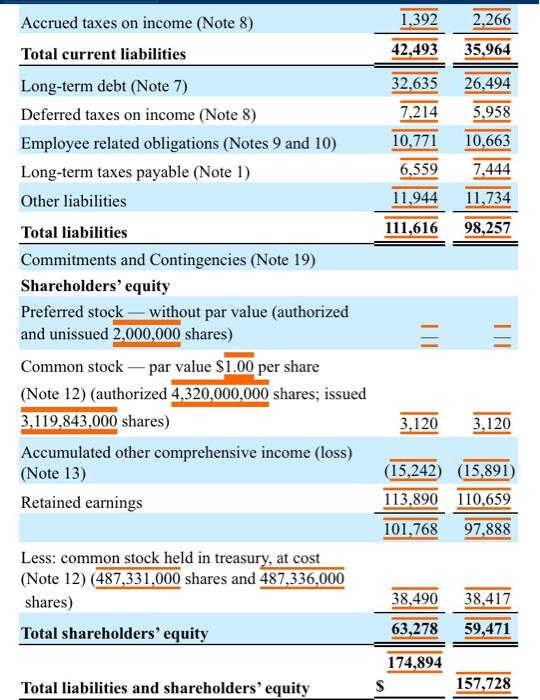
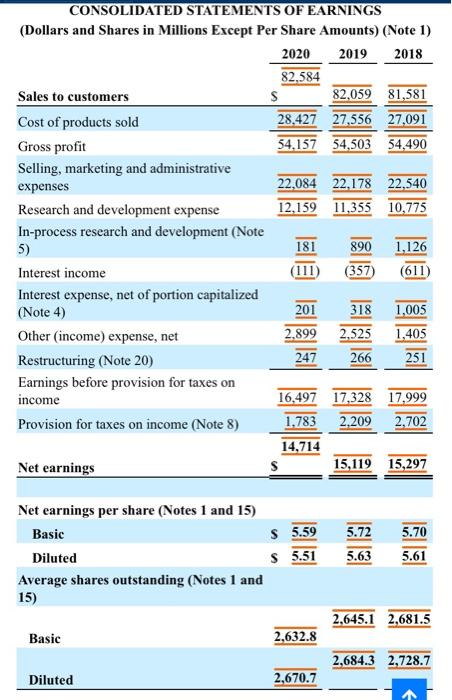
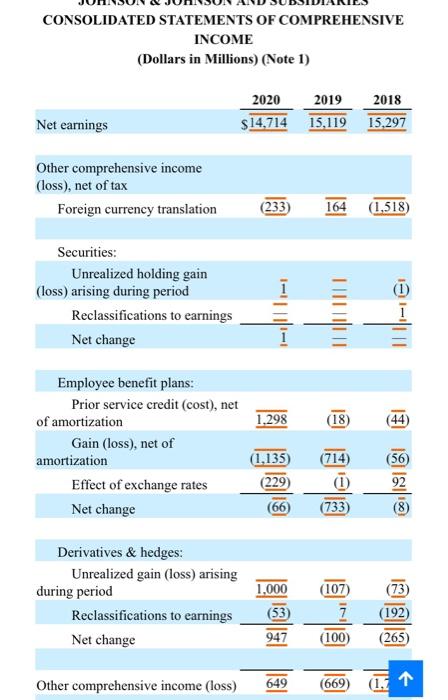
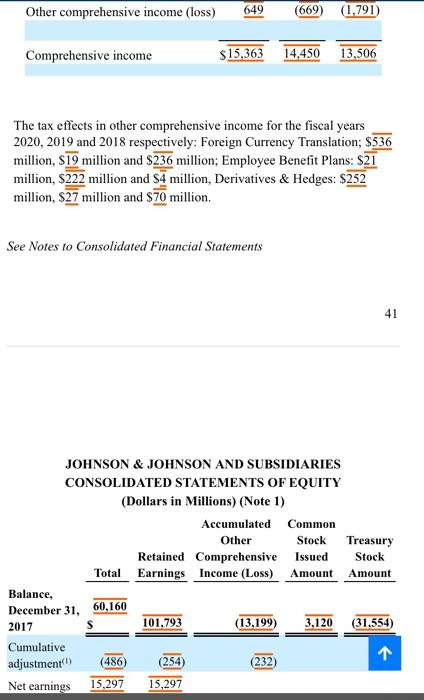
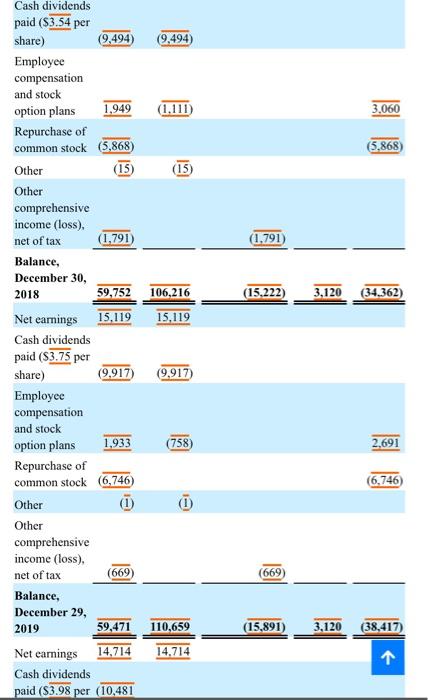
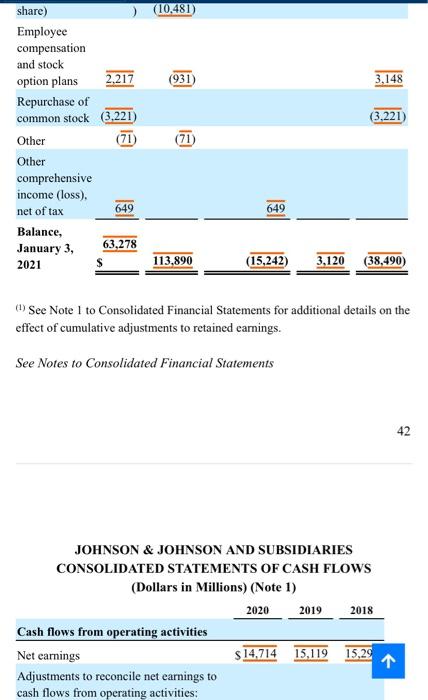
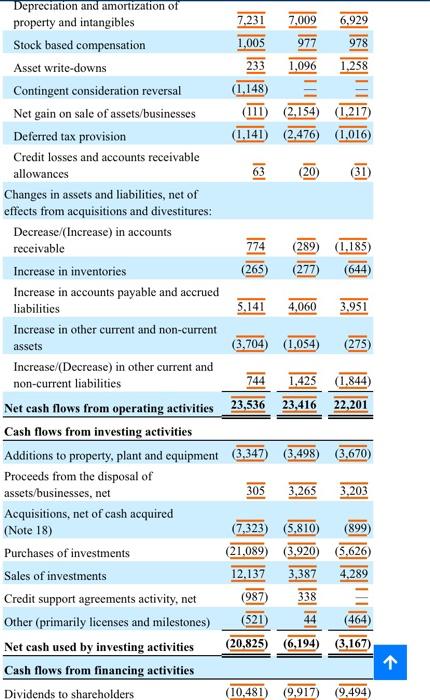
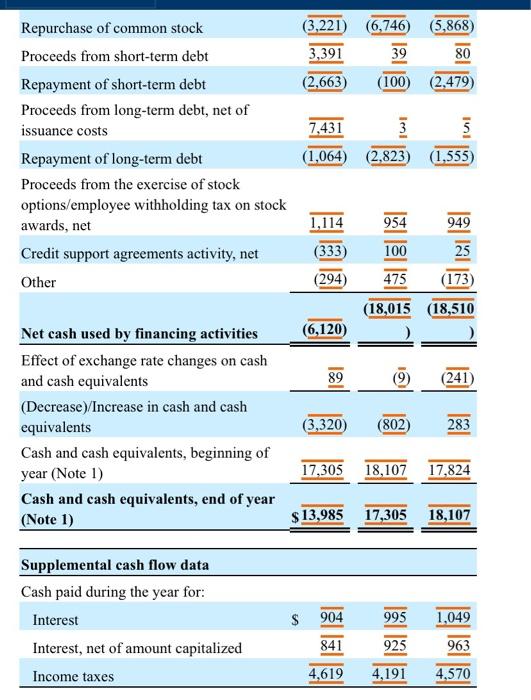
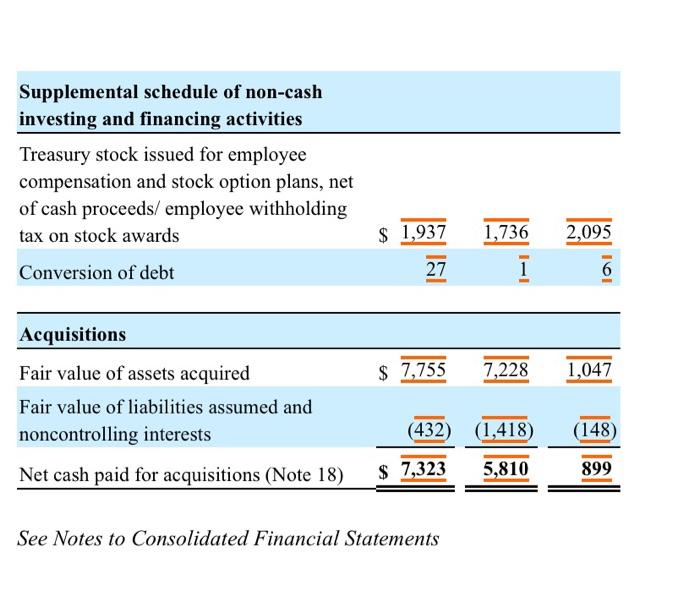

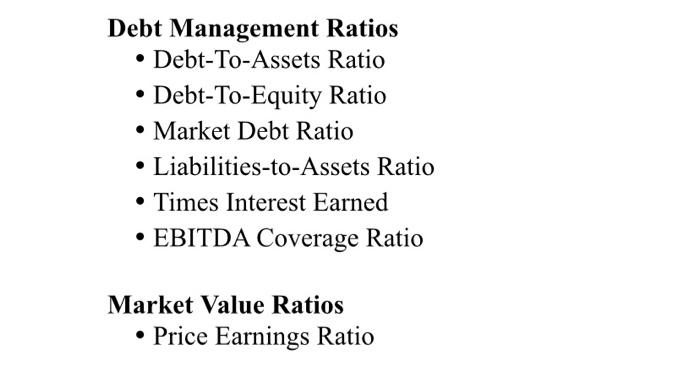
Asset Management Rations Total Assets Turnover Ratio Fixed Assets Turnover Ratio Days Sales Outstanding Inventory Turnover Ratio 94 JOHNSON & JOHNSON AND SUBSIDIARIES CONSOLIDATED BALANCE SHEETS At January 3, 2021 and December 29, 2019 (Dollars in Millions Except Share and Per Share Amounts) (Note 1) 2020 2019 Assets Current assets Cash and cash equivalents (Notes 1 and 2) $ 13,985 17,305 Marketable securities (Notes 1 and 2) 11,200 1.982 Accounts receivable trade, less allowances for doubtful accounts S293 (2019, $226) 13,576 14,481 Inventories (Notes 1 and 3) 9,344 9,020 Prepaid expenses and other receivables 3,132 2.392 Assets held for sale (Note 18) Total current assets 51,237 45,274 Property, plant and equipment, net (Notes 1 and 4) 18,766 17,658 Intangible assets, net (Notes 1 and 5) 53,402 47.643 Goodwill (Notes 1 and 5) 36,393 33,639 Deferred taxes on income (Note 8) 8,534 7,819 Other assets 6,562 5,695 174,894 Total assets 157,728 Liabilities and Shareholders' Equity Current liabilities Loans and notes payable (Note 7) 1.202 Accounts payable 9,505 8,544 Accrued liabilities 13,968 9,715 Accrued rebates, returns and promotions 11,513 10,883 Accrued compensation and employee related obligations 3.484 3.354 Accrued taxes on income (Note 8) 1,392 Total current liabilities 42,493 $ 2.631 35,964 1,392 2.266 42,493 35,964 32,635 7,214 10,771 6,559 11,944 111,616 26,494 5,958 10,663 7.444 11,734 98,257 Accrued taxes on income (Note 8) Total current liabilities Long-term debt (Note 7) Deferred taxes on income (Note 8) Employee related obligations (Notes 9 and 10) Long-term taxes payable (Note 1) Other liabilities Total liabilities Commitments and Contingencies (Note 19) Shareholders' equity Preferred stock without par value (authorized and unissued 2,000,000 shares) Common stock - par value $1.00 per share (Note 12) (authorized 4,320,000,000 shares; issued 3,119,843,000 shares) Accumulated other comprehensive income (loss) (Note 13) Retained earnings III 3,120 3,120 (15,242) (15,891) 113,890 110,659 101,768 97,888 Less: common stock held in treasury, at cost (Note 12) (487,331,000 shares and 487,336,000 shares) Total shareholders' equity 38,417 38,490 63,278 59,471 174,894 S Total liabilities and shareholders' equity 157,728 CONSOLIDATED STATEMENTS OF EARNINGS (Dollars and Shares in Millions Except Per Share Amounts) (Note 1) 2020 2019 2018 82,584 Sales to customers s 82,059 81,581 Cost of products sold 28,427 27,556 27.091 Gross profit 54.157 54,503 54,490 Selling, marketing and administrative expenses 22,084 22,178 22,540 Research and development expense 12,159 11,355 10,775 In-process research and development (Note 5) 181 890 1,126 Interest income (111 (357) (611 Interest expense, net of portion capitalized (Note 4) 201 318 1,005 Other (income) expense, net 2,899 2,525 1,405 Restructuring (Note 20) 247 266 251 Earnings before provision for taxes on income 16,497 17,328 17,999 Provision for taxes on income (Note 8) 1,783 2,209 2,702 14,714 Net earnings S 15,119 15,297 5.70 Net earnings per share (Notes 1 and 15) Basic Diluted Average shares outstanding (Notes 1 and 15) S 5.59 S5.51 5.72 5.63 5.61 2,645.1 2,681.5 Basic 2,632.8 2,684.3 2,728.7 Diluted 2,670.7 CONSOLIDATED STATEMENTS OF COMPREHENSIVE INCOME (Dollars in Millions) (Note 1) 2020 2019 2018 $14,714 15,119 15,297 Net earnings Other comprehensive income (loss), net of tax Foreign currency translation (233) 164 (1,518) (1) Securities: Unrealized holding gain (loss) arising during period Reclassifications to earnings Net change TITUT 1.298 (18) (44) Employee benefit plans: Prior service credit (cost), net of amortization Gain (loss), net of amortization Effect of exchange rates Net change (714) (1,135 (229) (56 92 (66) (733) Derivatives & hedges: Unrealized gain (loss) arising during period Reclassifications to earnings Net change 1.000 (107) (53 7 (100) (73) (192 (265) 947 Other comprehensive income (loss) 649 669 (1,71 Other comprehensive income (loss) 649 (669) (1.791) Comprehensive income $15.363 14.450 13.506 The tax effects in other comprehensive income for the fiscal years 2020, 2019 and 2018 respectively: Foreign Currency Translation; $536 million, S19 million and $236 million; Employee Benefit Plans: S21 million, 5222 million and S4 million, Derivatives & Hedges: $252 million, 27 million and $70 million. See Notes to Consolidated Financial Statements 41 JOHNSON & JOHNSON AND SUBSIDIARIES CONSOLIDATED STATEMENTS OF EQUITY (Dollars in Millions) (Note 1) Accumulated Common Other Stock Treasury Retained Comprehensive Issued Stock Total Earnings Income (Loss) Amount Amount Balance, December 31, 60,160 101,793 (13,199) 3,120 (31.554) 2017 Cumulative adjustment) Net earnings 1 (486 (254) (232 15,297 15,297 3.060 (5,868 (1.791) (15,222) 3.120 (34.362) Cash dividends paid ($3.54 per share) (9,494) (9,494) Employee compensation and stock option plans 1,949 (1.111) Repurchase of common stock (5,868) Other (15) (15) Other comprehensive income (loss). net of tax (1,791 Balance, December 30, 2018 59,752 106,216 Net earnings 15,119 15,119 Cash dividends paid (S3.75 per share) (9,917) (9,917 Employee compensation and stock option plans 1,933 (758) Repurchase of common stock 6,746) Other D) Other comprehensive income (loss), net of tax (669 Balance, December 29, 2019 59,471 110,659 Net earnings 14,714 14.714 Cash dividends paid (53.98 per (10,481 2.691 (6,746 669 (15,891) 3.120 (38,417) 3,148 (3,221 share) ) (10,481) Employee compensation and stock option plans 2,217 (931) Repurchase of common stock (3,221) Other (71) (71) Other comprehensive income (loss). net of tax 649 Balance, January 3, 63,278 2021 113,890 649 (15,242) 3,120 (38,490) My See Note I to Consolidated Financial Statements for additional details on the effect of cumulative adjustments to retained earnings. See Notes to Consolidated Financial Statements 42 2018 JOHNSON & JOHNSON AND SUBSIDIARIES CONSOLIDATED STATEMENTS OF CASH FLOWS (Dollars in Millions) (Note 1) 2020 2019 Cash flows from operating activities Net earnings 15,119 15,29 1 Adjustments to reconcile net earnings to cash flows from operating activities: $14.714 Depreciation and amortization of property and intangibles 7,231 7,009 6,929 Stock based compensation 1,005 977 978 Asset write-downs 233 1,096 1,258 Contingent consideration reversal (1,148 Net gain on sale of assets/businesses (111) 2,154) (1,217) Deferred tax provision (1.141) 2.476) (1,016) Credit losses and accounts receivable allowances 63 (20 (31) Changes in assets and liabilities, net of effects from acquisitions and divestitures: Decrease/(Increase) in accounts receivable 774 (289 (1,185 Increase in inventories (265 (277) (644 Increase in accounts payable and accrued liabilities 5,141 4,060 3.951 Increase in other current and non-current assets (3,704 (1,054) (275 Increase/(Decrease) in other current and non-current liabilities 744 1,425 (1.844) Net cash flows from operating activities 23,536 23,416 22,201 Cash flows from investing activities Additions to property, plant and equipment (3,347) (3,498) (3,670 Proceeds from the disposal of assets/businesses, net 305 3,265 3.203 Acquisitions, net of cash acquired (Note 18) (7,323) (5,810 (899) Purchases of investments (21,089) (3,920) (5,626) Sales of investments 12.137 3,387 4,289 Credit support agreements activity, net (987 Other (primarily licenses and milestones) (521 44 (464 Net cash used by investing activities (20.825 (6,194) (3.167 Cash flows from financing activities Dividends to shareholders (10,481) (9,917) (9,494) 338 1 (6,746) (5,868) (3,221) 3,391 39 80 (2,663) (100) (2,479) iul Repurchase of common stock Proceeds from short-term debt Repayment of short-term debt Proceeds from long-term debt, net of issuance costs Repayment of long-term debt Proceeds from the exercise of stock options/employee withholding tax on stock awards, net Credit support agreements activity, net Other 7,431 3 (1,064) (2,823) (1,555) 954 949 1,114 (333) (294) 25 100 475 (173) (18,015 (18,510 (6,120) 89 (241) Net cash used by financing activities Effect of exchange rate changes on cash and cash equivalents (Decrease)/Increase in cash and cash equivalents Cash and cash equivalents, beginning of year (Note 1) Cash and cash equivalents, end of year (Note 1) (3,320) (802) 283 17,305 18,107 17,824 $ 13,985 17,305 18,107 Supplemental cash flow data Cash paid during the year for: Interest Interest, net of amount capitalized Income taxes $ 904 995 1,049 841 925 963 4,619 4,191 4,570 Supplemental schedule of non-cash investing and financing activities Treasury stock issued for employee compensation and stock option plans, net of cash proceeds/ employee withholding tax on stock awards Conversion of debt $ 1,937 1,736 2,095 27 1 6 $ 7,755 7,228 1,047 Acquisitions Fair value of assets acquired Fair value of liabilities assumed and noncontrolling interests Net cash paid for acquisitions (Note 18) (432) (1,418) (148) $ 7,323 5,810 899 See Notes to Consolidated Financial Statements Liquidity Ratios Current Ratio Quick Ratio Debt Management Ratios Debt-To-Assets Ratio Debt-To-Equity Ratio Market Debt Ratio Liabilities-to-Assets Ratio Times Interest Earned EBITDA Coverage Ratio Market Value Ratios Price Earnings Ratio
Step by Step Solution
There are 3 Steps involved in it

Get step-by-step solutions from verified subject matter experts