

Question: I need help solving this problem. 1) From the Descriptives and Frequencies of Environment tables and Plots charts, interpret the results in paragraph format according
I need help solving this problem. 1) From the Descriptives and Frequencies of Environment tables and Plots charts, interpret the results in paragraph format according to APA guidelines. 2) Summarize the data in a paragraph, highlighting key findings (e.g., distribution shape, central tendency, variability), also according to APA guidelines.
| Descriptives | |||||||
|---|---|---|---|---|---|---|---|
| Sound | Environment | TestScore | |||||
| N | 299 | 299 | 299 | ||||
| Missing | 0 | 0 | 0 | ||||
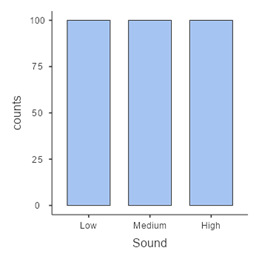
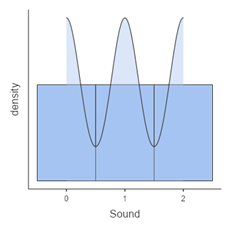
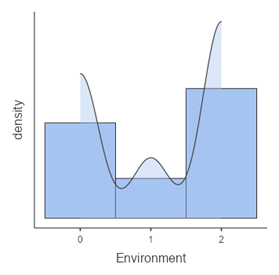
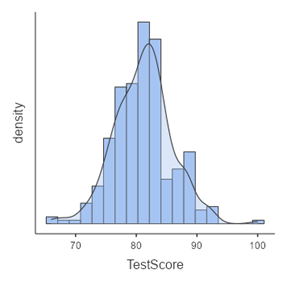
| Mean | 0.997 | 1.13 | 81.1 | ||||
| Median | 1 | 1 | 81.0 | ||||
| Standard deviation | 0.817 | 0.916 | 4.63 | ||||
| Minimum | 0 | 0 | 66.0 | ||||
| Maximum | 2 | 2 | 93.0 | ||||
| Frequencies of Environment | |||||||
|---|---|---|---|---|---|---|---|
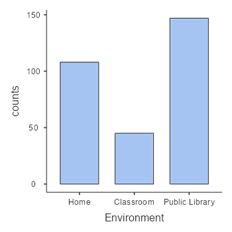
| Environment | Counts | % of Total | Cumulative % | ||||
| Home | 108 | 36.0?% | 36.0?% | ||||
| Classroom | 45 | 15.0?% | 51.0?% | ||||
| Public Library | 147 | 49.0?% | 100.0?% | ||||
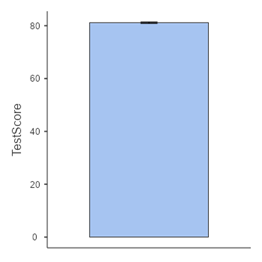
Plots
Sound
Step by Step Solution
There are 3 Steps involved in it
1 Expert Approved Answer
Step: 1 Unlock

Question Has Been Solved by an Expert!
Get step-by-step solutions from verified subject matter experts
Step: 2 Unlock
Step: 3 Unlock