

Question: I need help solving this problem len samples of 15 parts each were taken from an ongoing process to establish a p-chart for control. The
I need help solving this problem
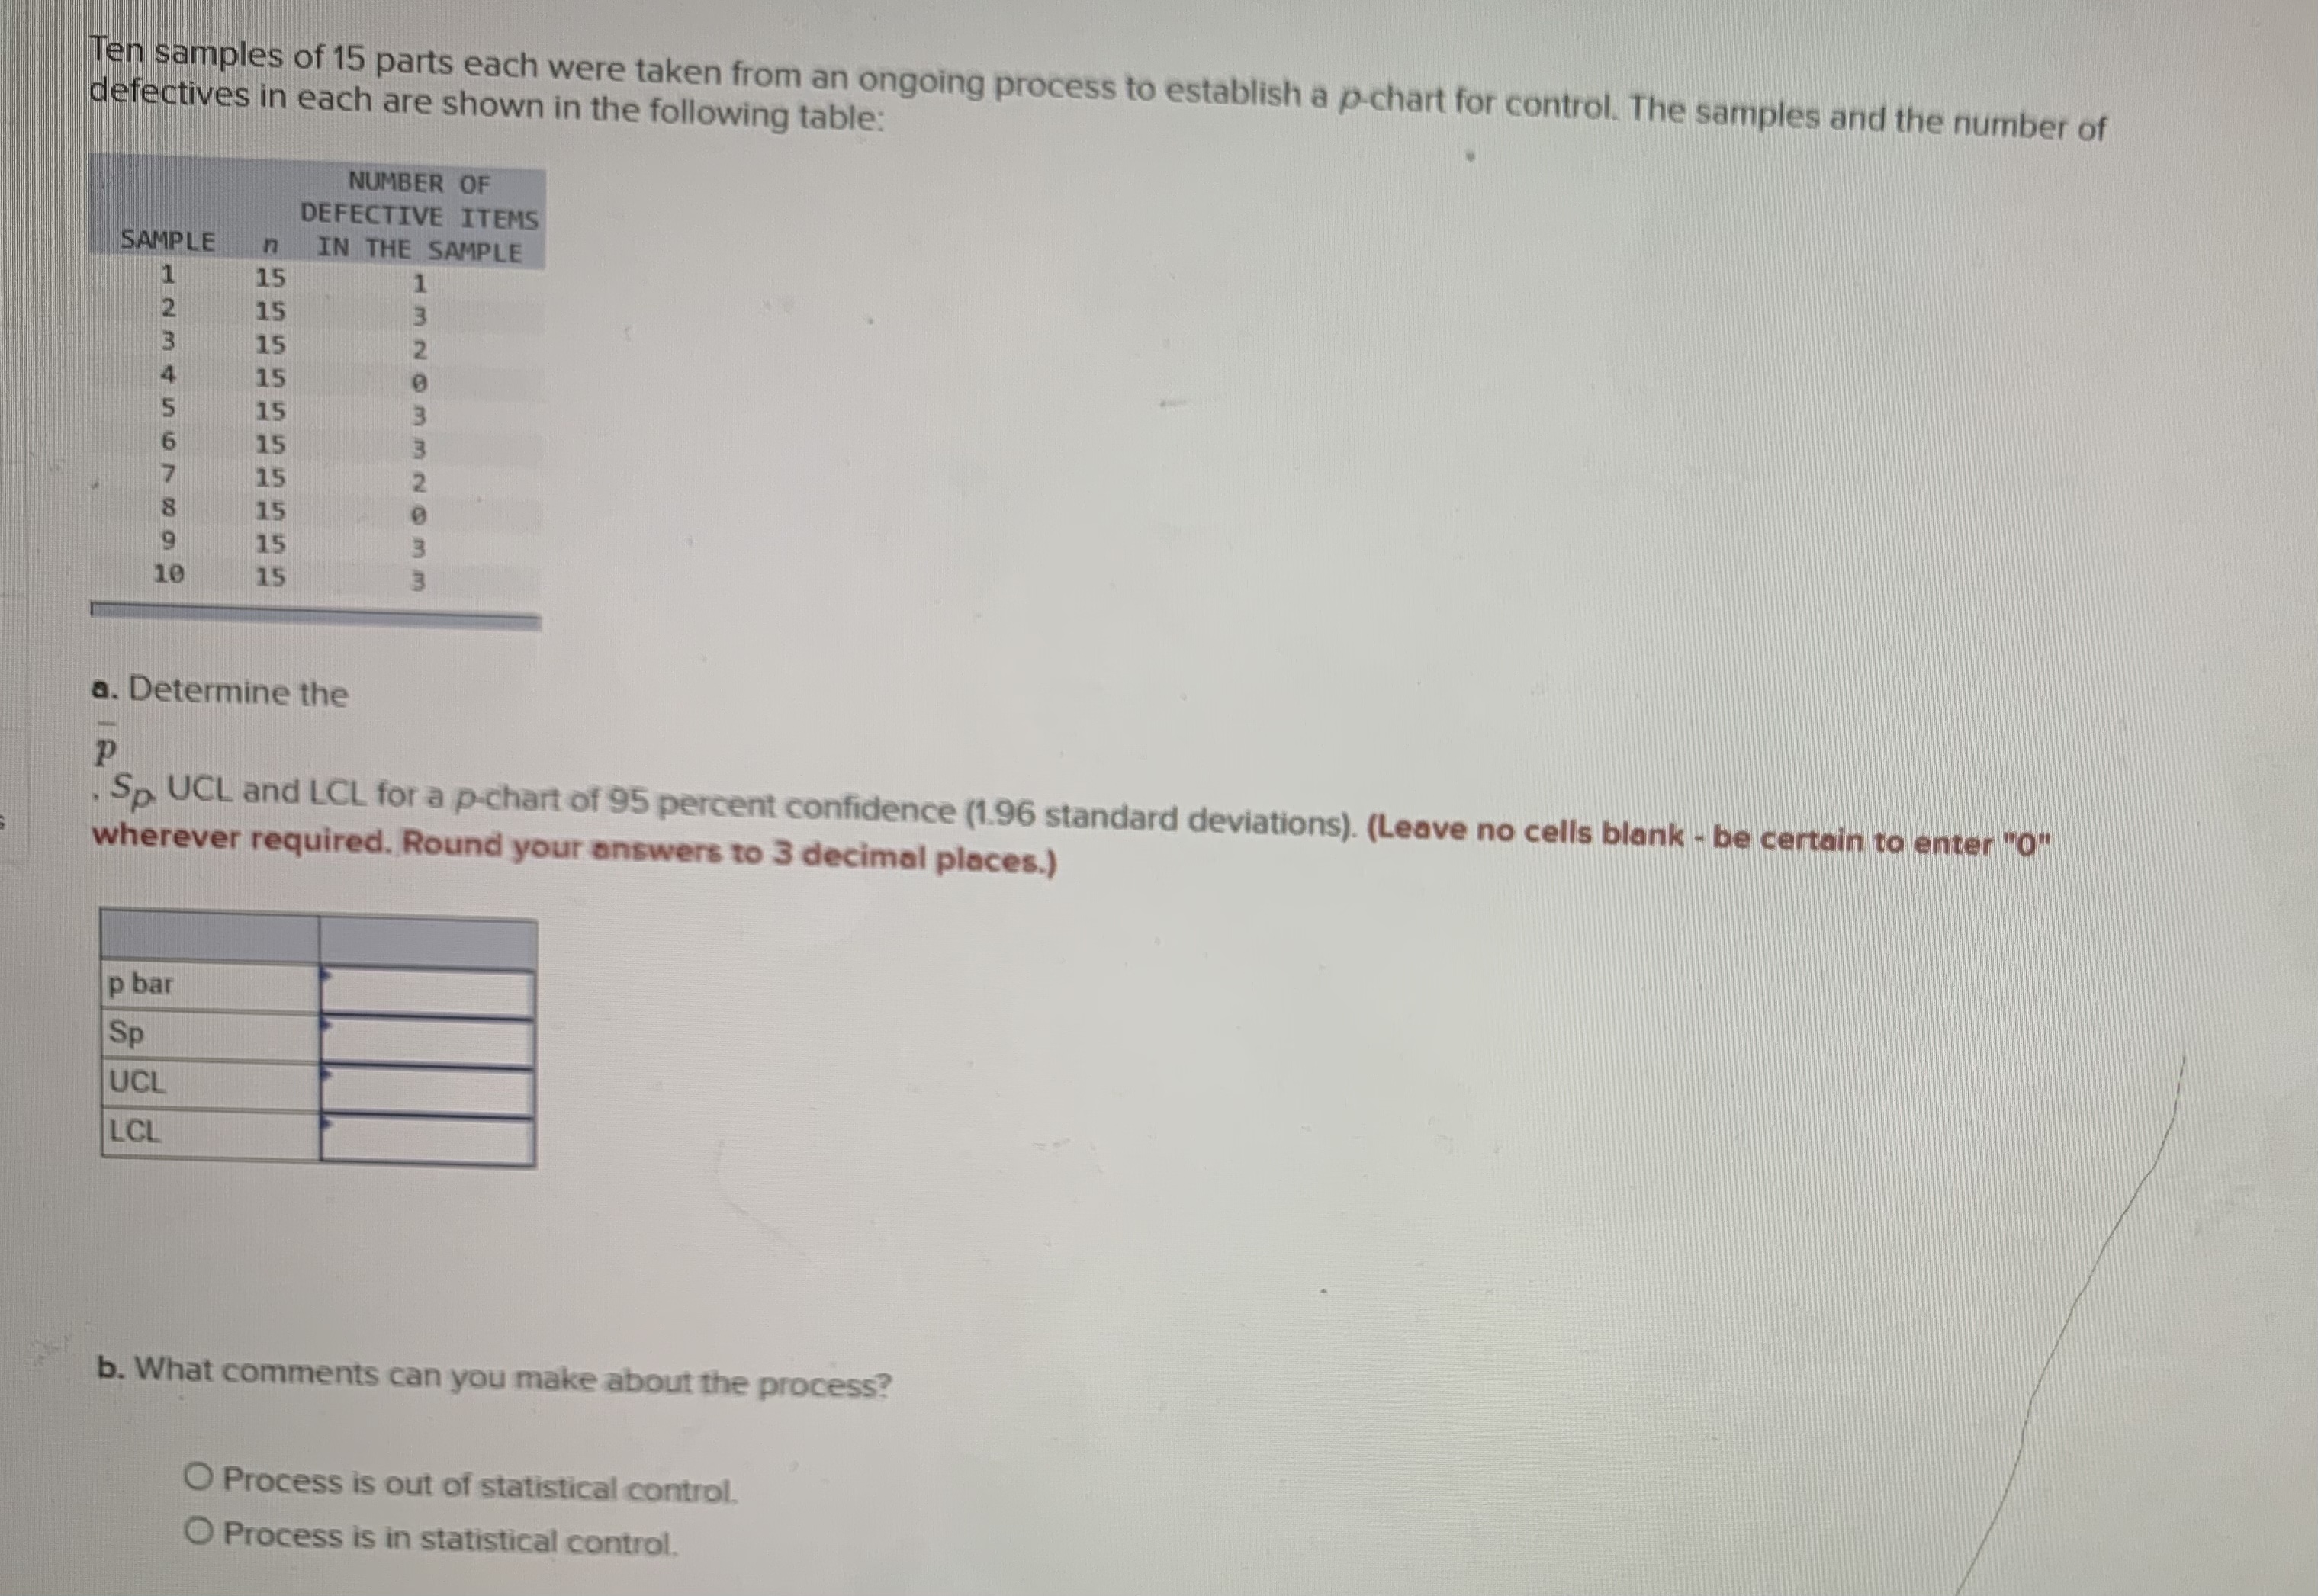
len samples of 15 parts each were taken from an ongoing process to establish a p-chart for control. The samples and the number of defectives in each are shown in the following table: NUMBER OF DEFECTIVE ITEMS SAMPLE n IN THE SAMPLE 1 15 15 15 15 15 15 WWONWWONW 15 15 15 15 a. Determine the P . Sp. UCL and LCL for a p-chart of 95 percent confidence (1.96 standard deviations). (Leave no cells blank - be certain to enter "0" wherever required. Round your answers to 3 decimal places.) p bar Sp UCL LCL b. What comments can you make about the process? O Process is out of statistical control. O Process is in statistical control
Step by Step Solution
There are 3 Steps involved in it

Get step-by-step solutions from verified subject matter experts