

Question: I need help solving this problem. Please examine the data for potential outliers and ensure it meets key assumptions for regression. From the table and
I need help solving this problem. Please examine the data for potential outliers and ensure it meets key assumptions for regression. From the table and charts below, please describe the following:
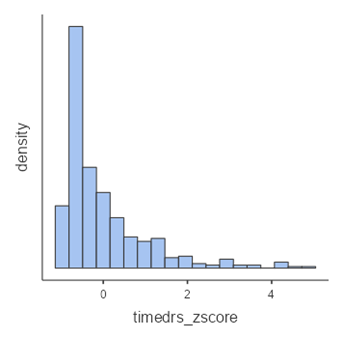
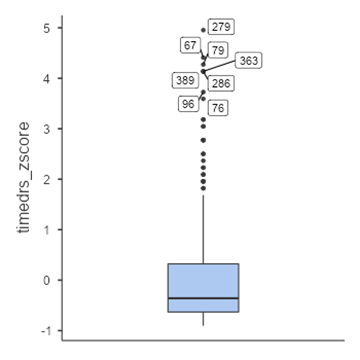
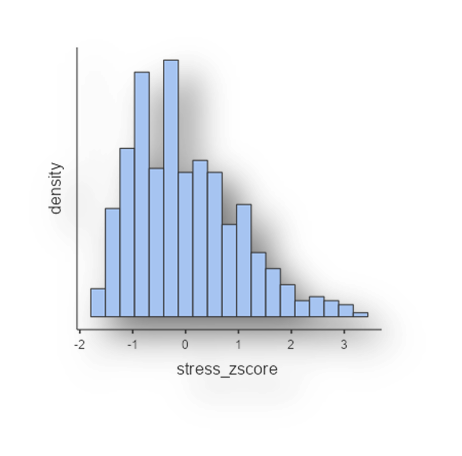
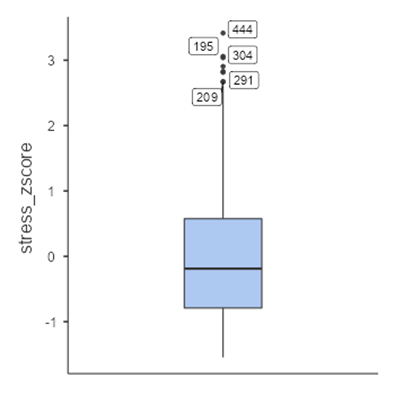
1)For Univariate Outliers, use z-scores and boxplots to identify any outliers in timedrs and stress.
2)Identify values with z-scores > 3.3.
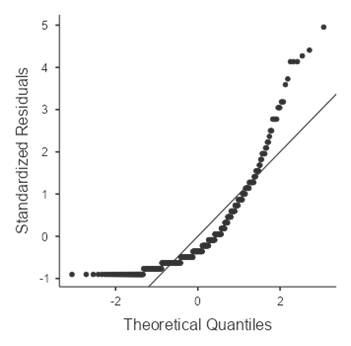
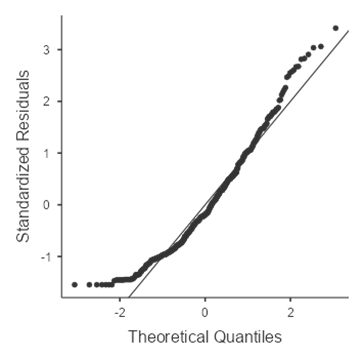
3)Are the distributions approximately normal?
4) Discuss whether these values appear to be true outliers and how you would handle them such as retain, transform, or exclude, but do not remove any outliers.
Please respond in paragraph format and in APA guidelines. Thank you.
| Descriptives | |||||
|---|---|---|---|---|---|
| timedrs_zscore | stress_zscore | ||||
| N | 453 | 453 | |||
| Missing | 0 | 0 | |||
| Mean | -3.69e?17 | -7.35e?17 | |||
| Median | -0.358 | -0.188 | |||
| Standard deviation | 1.00 | 1.00 | |||
| Minimum | -0.903 | -1.55 | |||
| Maximum | 4.95 | 3.42 | |||
| Skewness | 2.09 | 0.761 | |||
| Std. error skewness | 0.115 | 0.115 | |||
| Kurtosis | 5.08 | 0.240 | |||
| Std. error kurtosis | 0.229 | 0.229 | |||
Step by Step Solution
There are 3 Steps involved in it
1 Expert Approved Answer
Step: 1 Unlock

Question Has Been Solved by an Expert!
Get step-by-step solutions from verified subject matter experts
Step: 2 Unlock
Step: 3 Unlock