

Question: I need help solving this problem? X 11) Let g(x) = | f(t) dt, where f is the function shown. Graph of f 0 a)
I need help solving this problem?
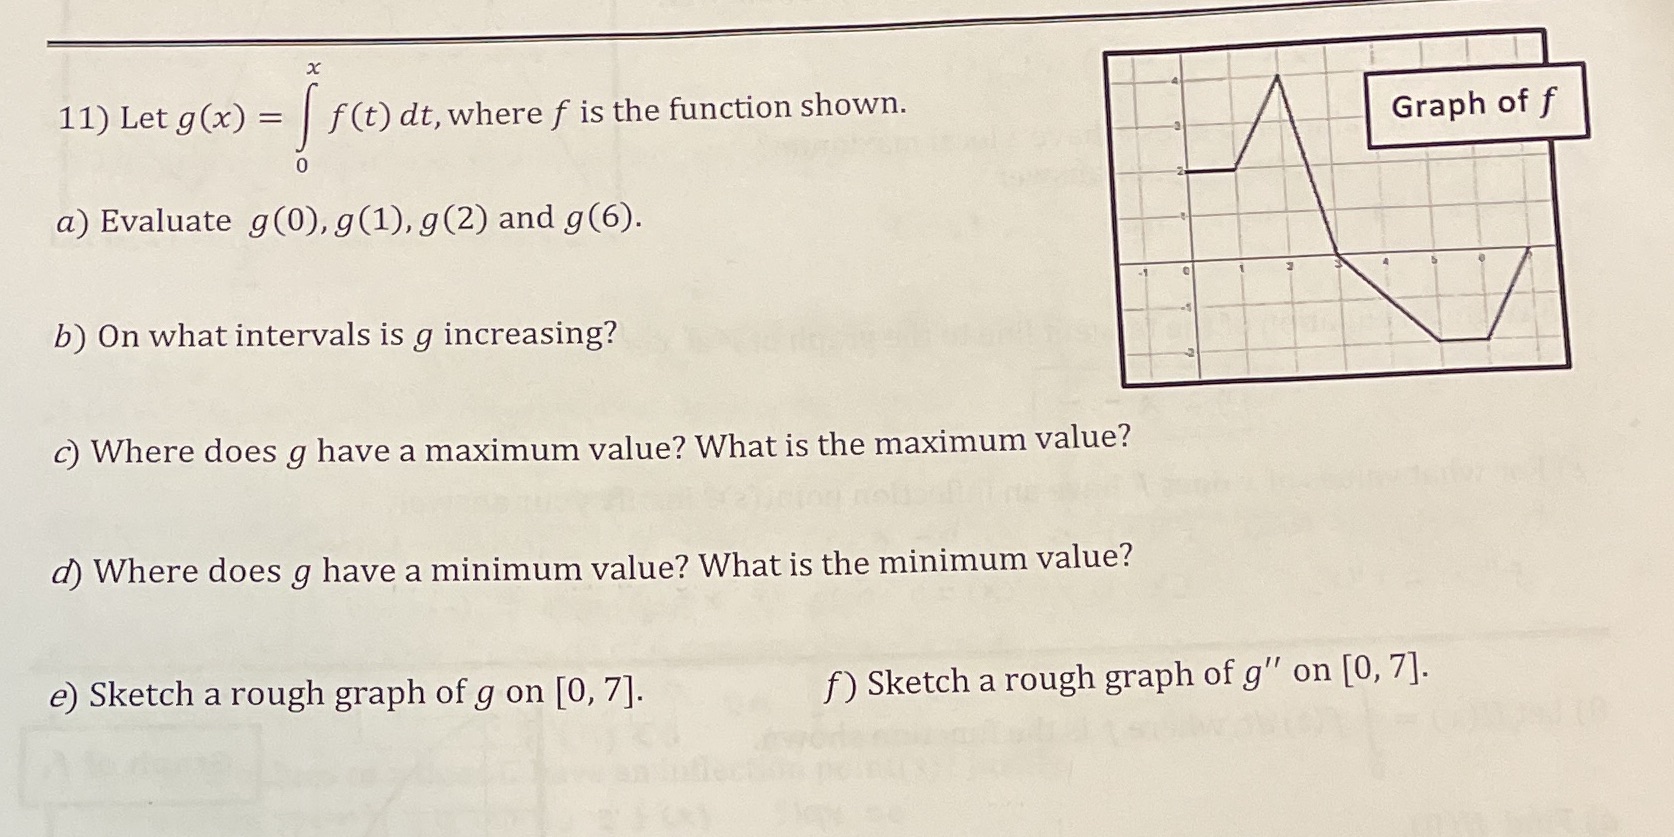
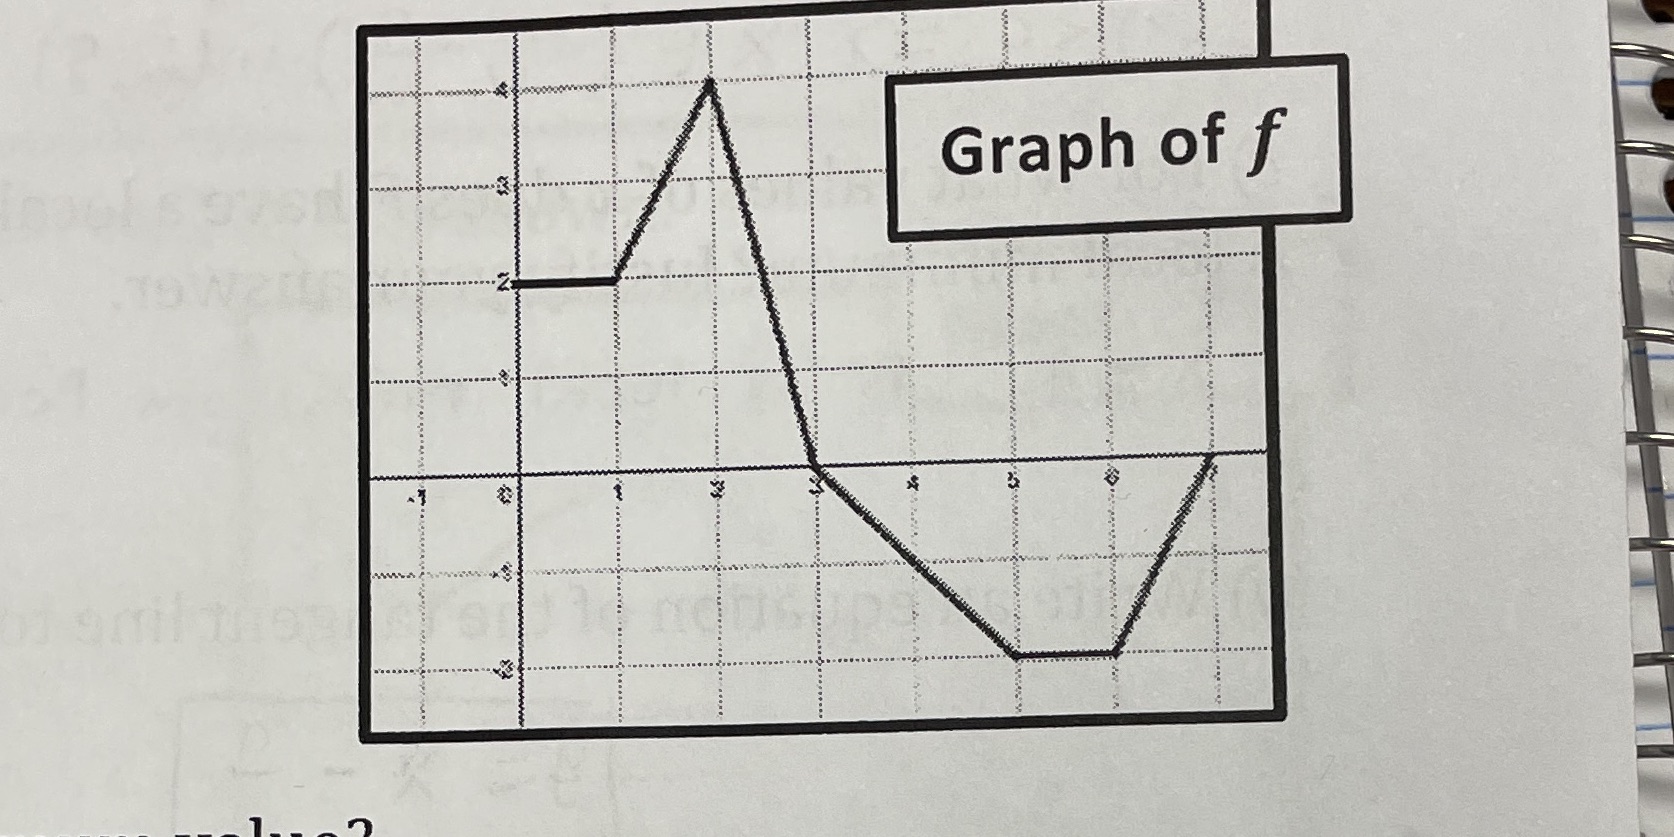
X 11) Let g(x) = | f(t) dt, where f is the function shown. Graph of f 0 a) Evaluate g(0), g(1), g(2) and g (6). b) On what intervals is g increasing? c) Where does g have a maximum value? What is the maximum value? d) Where does g have a minimum value? What is the minimum value? e) Sketch a rough graph of g on [0, 7]. f) Sketch a rough graph of g" on [0, 7].
Step by Step Solution
There are 3 Steps involved in it
1 Expert Approved Answer
Step: 1 Unlock

Question Has Been Solved by an Expert!
Get step-by-step solutions from verified subject matter experts
Step: 2 Unlock
Step: 3 Unlock