

Question: I need help solving this using excel. Thank you :) A project conducted by the Australian Federal Office of Road Safety asked people many questions
I need help solving this using excel.
Thank you :)
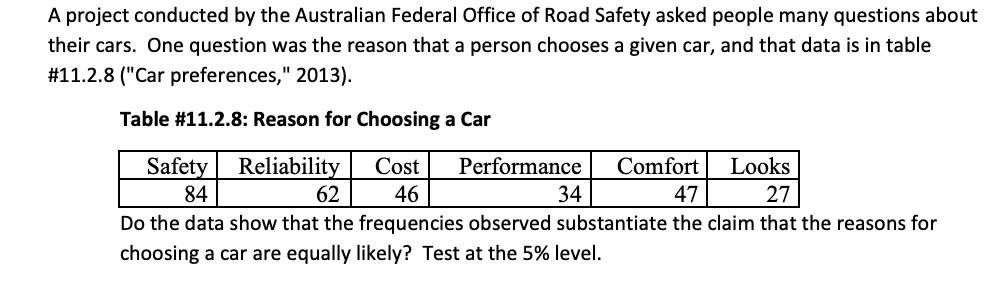
A project conducted by the Australian Federal Office of Road Safety asked people many questions about their cars. One question was the reason that a person chooses a given car, and that data is in table #11.2.8 ("Car preferences," 2013). Table $112.8: Reason for Choosing a Car Do the data show that the frequencies observed substantiate the claim that the reasons for choosing a car are equally likely? Test at the 5% level
Step by Step Solution
There are 3 Steps involved in it
1 Expert Approved Answer
Step: 1 Unlock

Question Has Been Solved by an Expert!
Get step-by-step solutions from verified subject matter experts
Step: 2 Unlock
Step: 3 Unlock