

Question: i need help The circle graph shows how a state disposed of its municipal solid waste in 2008. Answer parts (a), (b), and (c). I
i need help
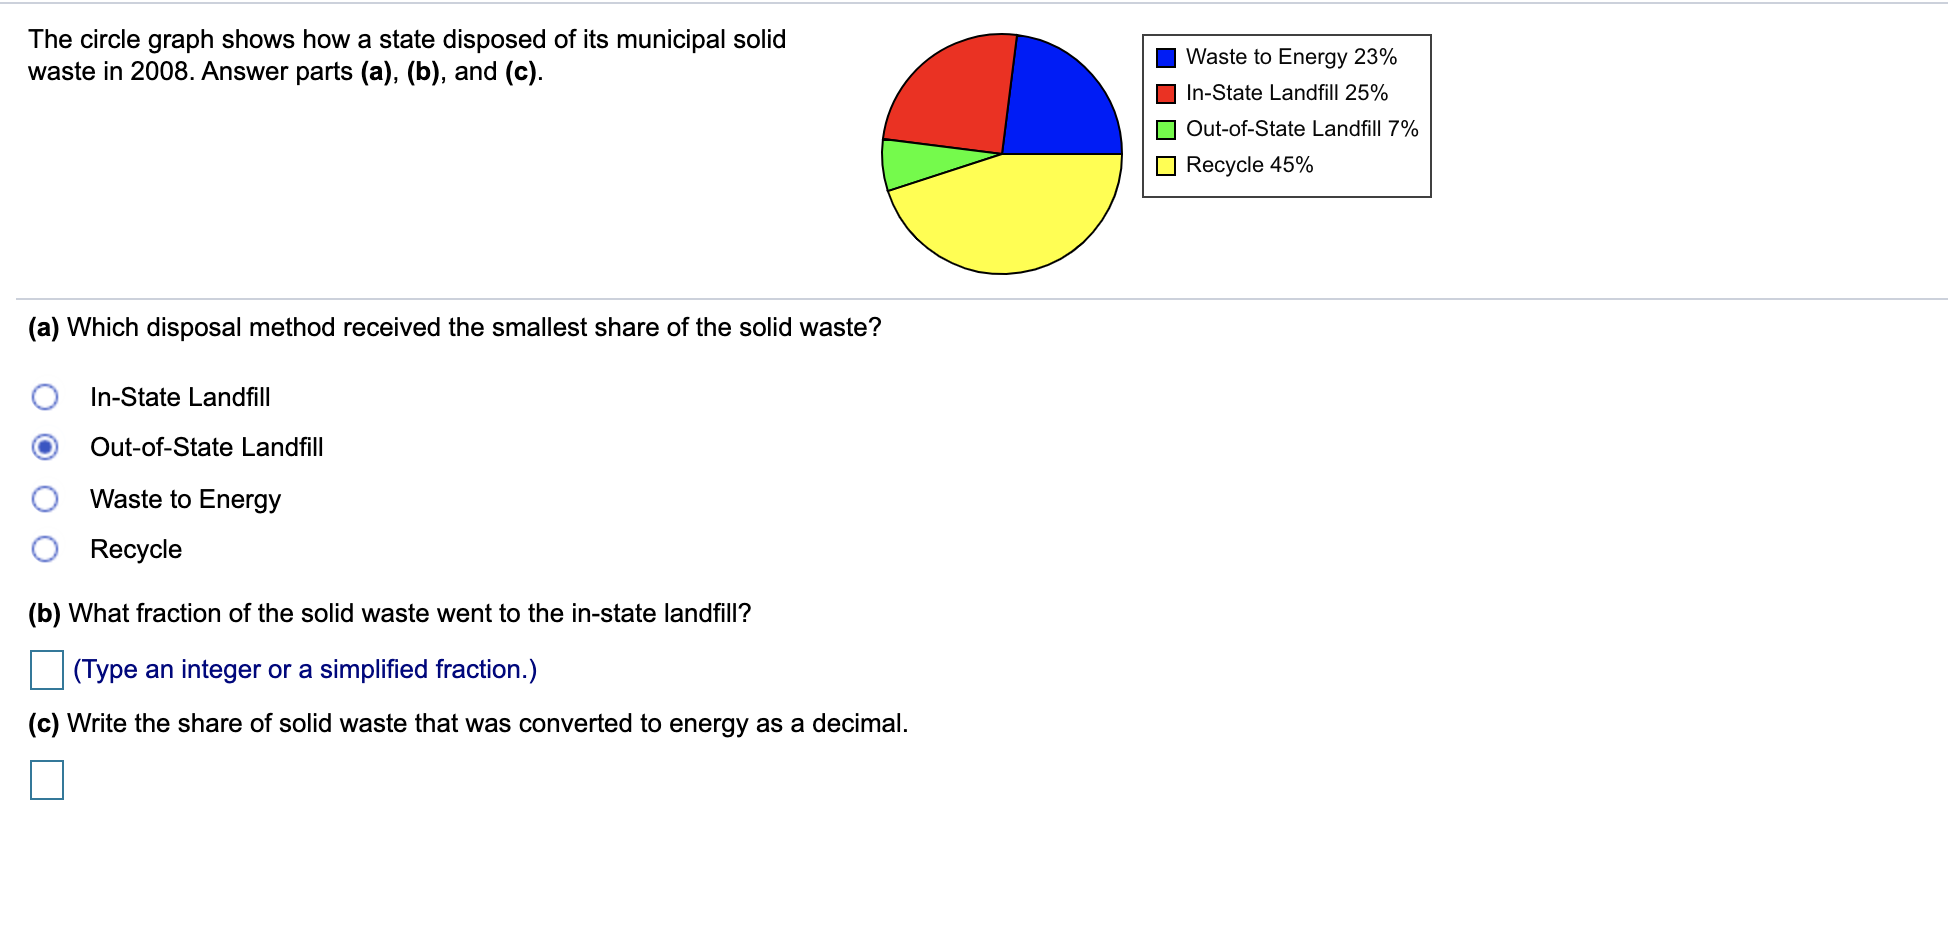
The circle graph shows how a state disposed of its municipal solid waste in 2008. Answer parts (a), (b), and (c). I was"? ' Ene'gy 2\" I In-State Landll 25% :I Out-of-State Landll 7% :| Recycle 45% (a) Which disposal method received the smallest share of the solid waste? 0 ln-State Landll Out-ofState Landll 0 Waste to Energy 0 Recycle (b) What fraction of the solid waste went to the in-state landll? |:| (Type an integer or a simplied fraction.) (6) Write the share of solid waste that was converted to energy as a decimal. D
Step by Step Solution
There are 3 Steps involved in it
1 Expert Approved Answer
Step: 1 Unlock

Question Has Been Solved by an Expert!
Get step-by-step solutions from verified subject matter experts
Step: 2 Unlock
Step: 3 Unlock