

Question: I need help to do this assignment... All questions to be answered... Overview There are no doubts that ITs are the key factors in business
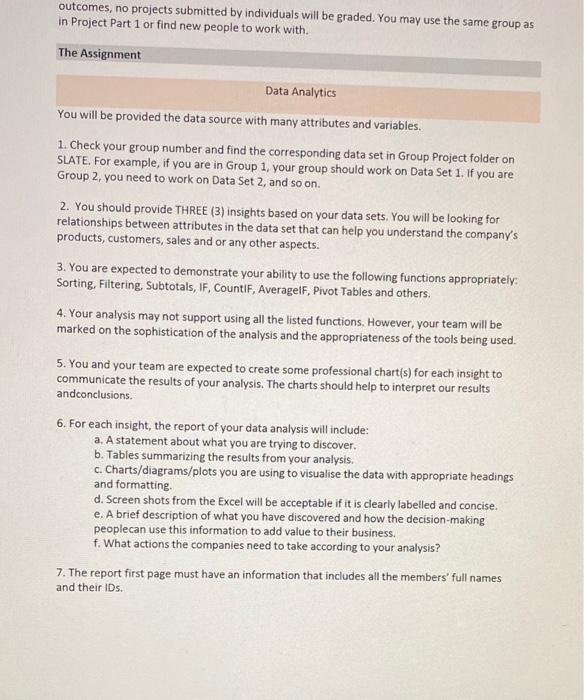
Overview There are no doubts that ITs are the key factors in business and industry development. Companies are always looking for more intelligent solutions for their businesses in order to improve their processes and achieve superior results. When companies adopt Business Analytics tools, they are taking advantage of solutions to their business problems, by transforming data into knowledge for decision making. Usually Business Analytics includes "decision management, content analytics, planning and forecasting, discovery and exploration, business intelligence, predictive analytics, data and content management, stream computing, data warehousing information integration and governance". Data Analytics and Data Visualization are two very powerful tools widely used to provide decision-makers with measurable, relevant, easy to understand input. it's well known that Analytics Methods are used at all stages of information processing, but their real application efficiency depends upon an architecture of company's Information System (IS), since it establishes the foundation for flexibility and interoperability of all available methods provided by Is to analysts and management. Objective Teamwork in Excel Data Analysis of provided information to demonstrate your professional skills in finding some insights from the data sets, visualize these results in a clear and effective manner and make professional practical recommendations. Value and Due Date The Project Part2 is evaluated out of 15 marks and is worth 15% of your Course grade. See the Rubric section of this document for an outline of how this part of the Project will be graded. Your results should be submitted into the SLATE Assignment Dropboxes according to a deadline. Please be advised that your report will be automatically reviewed by TURNITIN, the anti-plagiarism software application. Be sure that your work is your own! Forming Groups This is a group project (2-4 students). As working in groups is one of the course learning outcomes, no projects submitted by individuals will be graded. You may use the same group as in Project Part 1 or find new people to work with. The Assignment Data Analytics You will be provided the data source with many attributes and variables. 1. Check your group number and find the corresponding data set in Group Project folder on SLATE. For example, if you are in Group 1, your group should work on Data Set 1. If you are Group 2, you need to work on Data Set 2, and so on. 2. You should provide THREE (3) insights based on your data sets, You will be looking for relationships between attributes in the data set that can help you understand the company's products, customers, sales and or any other aspects. 3. You are expected to demonstrate your ability to use the following functions appropriately: Sorting, Filtering, Subtotals, IF, CountiF, AveragelF, Pivot Tables and others. 4. Your analysis may not support using all the listed functions. However, your team will be marked on the sophistication of the analysis and the appropriateness of the tools being used. 5. You and your team are expected to create some professional charti(s) for each insight to communicate the results of your analysis. The charts should help to interpret our results andconclusions. 6. For each insight, the report of your data analysis will include: a. A statement about what you are trying to discover. b. Tables summarizing the results from your analysis. c. Charts/diagrams/plots you are using to visualise the data with appropriate headings and formatting. d. Screen shots from the Excel will be acceptable if it is clearly labelled and concise. e. A brief description of what you have discovered and how the decision-making peoplecan use this information to add value to their business. f. What actions the companies need to take according to your analysis? 7. The report first page must have an information that includes all the members' full names and their IDs. Evaluation Criteria, Rubrics This is a guide to help you achieve the expectations for the Project Part2. Overview There are no doubts that ITs are the key factors in business and industry development. Companies are always looking for more intelligent solutions for their businesses in order to improve their processes and achieve superior results. When companies adopt Business Analytics tools, they are taking advantage of solutions to their business problems, by transforming data into knowledge for decision making. Usually Business Analytics includes "decision management, content analytics, planning and forecasting, discovery and exploration, business intelligence, predictive analytics, data and content management, stream computing, data warehousing information integration and governance". Data Analytics and Data Visualization are two very powerful tools widely used to provide decision-makers with measurable, relevant, easy to understand input. it's well known that Analytics Methods are used at all stages of information processing, but their real application efficiency depends upon an architecture of company's Information System (IS), since it establishes the foundation for flexibility and interoperability of all available methods provided by Is to analysts and management. Objective Teamwork in Excel Data Analysis of provided information to demonstrate your professional skills in finding some insights from the data sets, visualize these results in a clear and effective manner and make professional practical recommendations. Value and Due Date The Project Part2 is evaluated out of 15 marks and is worth 15% of your Course grade. See the Rubric section of this document for an outline of how this part of the Project will be graded. Your results should be submitted into the SLATE Assignment Dropboxes according to a deadline. Please be advised that your report will be automatically reviewed by TURNITIN, the anti-plagiarism software application. Be sure that your work is your own! Forming Groups This is a group project (2-4 students). As working in groups is one of the course learning outcomes, no projects submitted by individuals will be graded. You may use the same group as in Project Part 1 or find new people to work with. The Assignment Data Analytics You will be provided the data source with many attributes and variables. 1. Check your group number and find the corresponding data set in Group Project folder on SLATE. For example, if you are in Group 1, your group should work on Data Set 1. If you are Group 2, you need to work on Data Set 2, and so on. 2. You should provide THREE (3) insights based on your data sets, You will be looking for relationships between attributes in the data set that can help you understand the company's products, customers, sales and or any other aspects. 3. You are expected to demonstrate your ability to use the following functions appropriately: Sorting, Filtering, Subtotals, IF, CountiF, AveragelF, Pivot Tables and others. 4. Your analysis may not support using all the listed functions. However, your team will be marked on the sophistication of the analysis and the appropriateness of the tools being used. 5. You and your team are expected to create some professional charti(s) for each insight to communicate the results of your analysis. The charts should help to interpret our results andconclusions. 6. For each insight, the report of your data analysis will include: a. A statement about what you are trying to discover. b. Tables summarizing the results from your analysis. c. Charts/diagrams/plots you are using to visualise the data with appropriate headings and formatting. d. Screen shots from the Excel will be acceptable if it is clearly labelled and concise. e. A brief description of what you have discovered and how the decision-making peoplecan use this information to add value to their business. f. What actions the companies need to take according to your analysis? 7. The report first page must have an information that includes all the members' full names and their IDs. Evaluation Criteria, Rubrics This is a guide to help you achieve the expectations for the Project Part2
Step by Step Solution
There are 3 Steps involved in it

Get step-by-step solutions from verified subject matter experts