

Question: I need help to make an excel chart for Chipotle Mexican Grill Inc. I have a project but I do not know how to do
I need help to make an excel chart for Chipotle Mexican Grill Inc. I have a project but I do not know how to do income statement or balance sheet.
Questions: 50-52 is excel need to be made
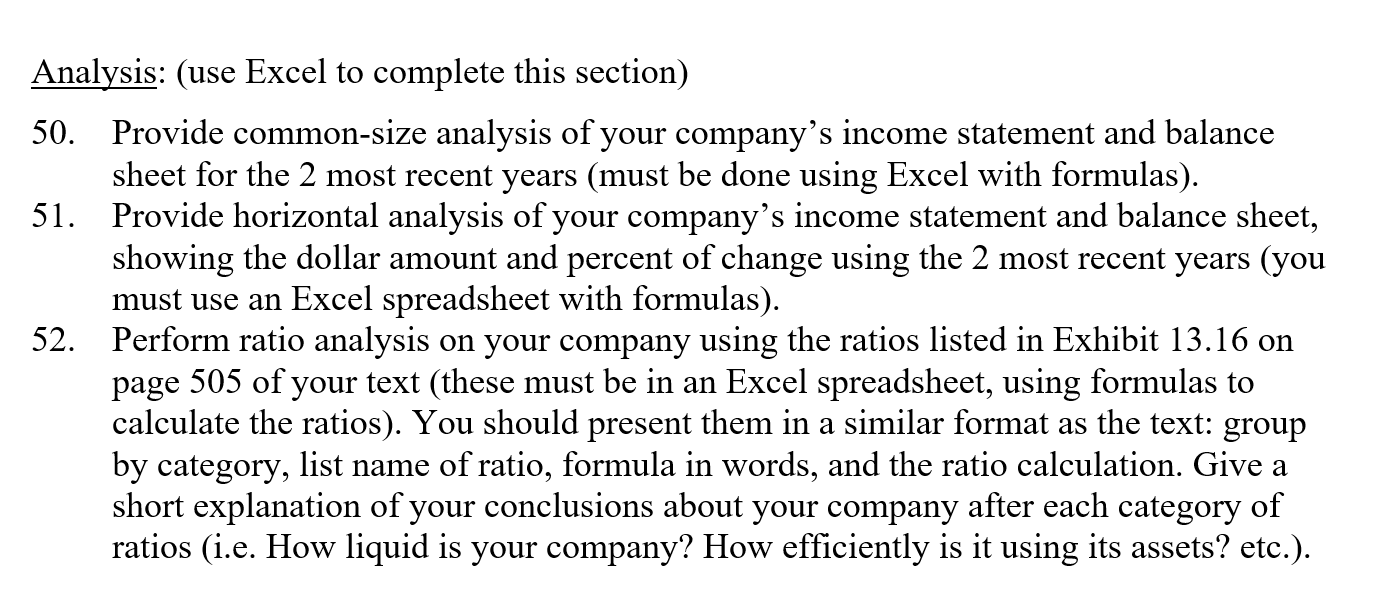
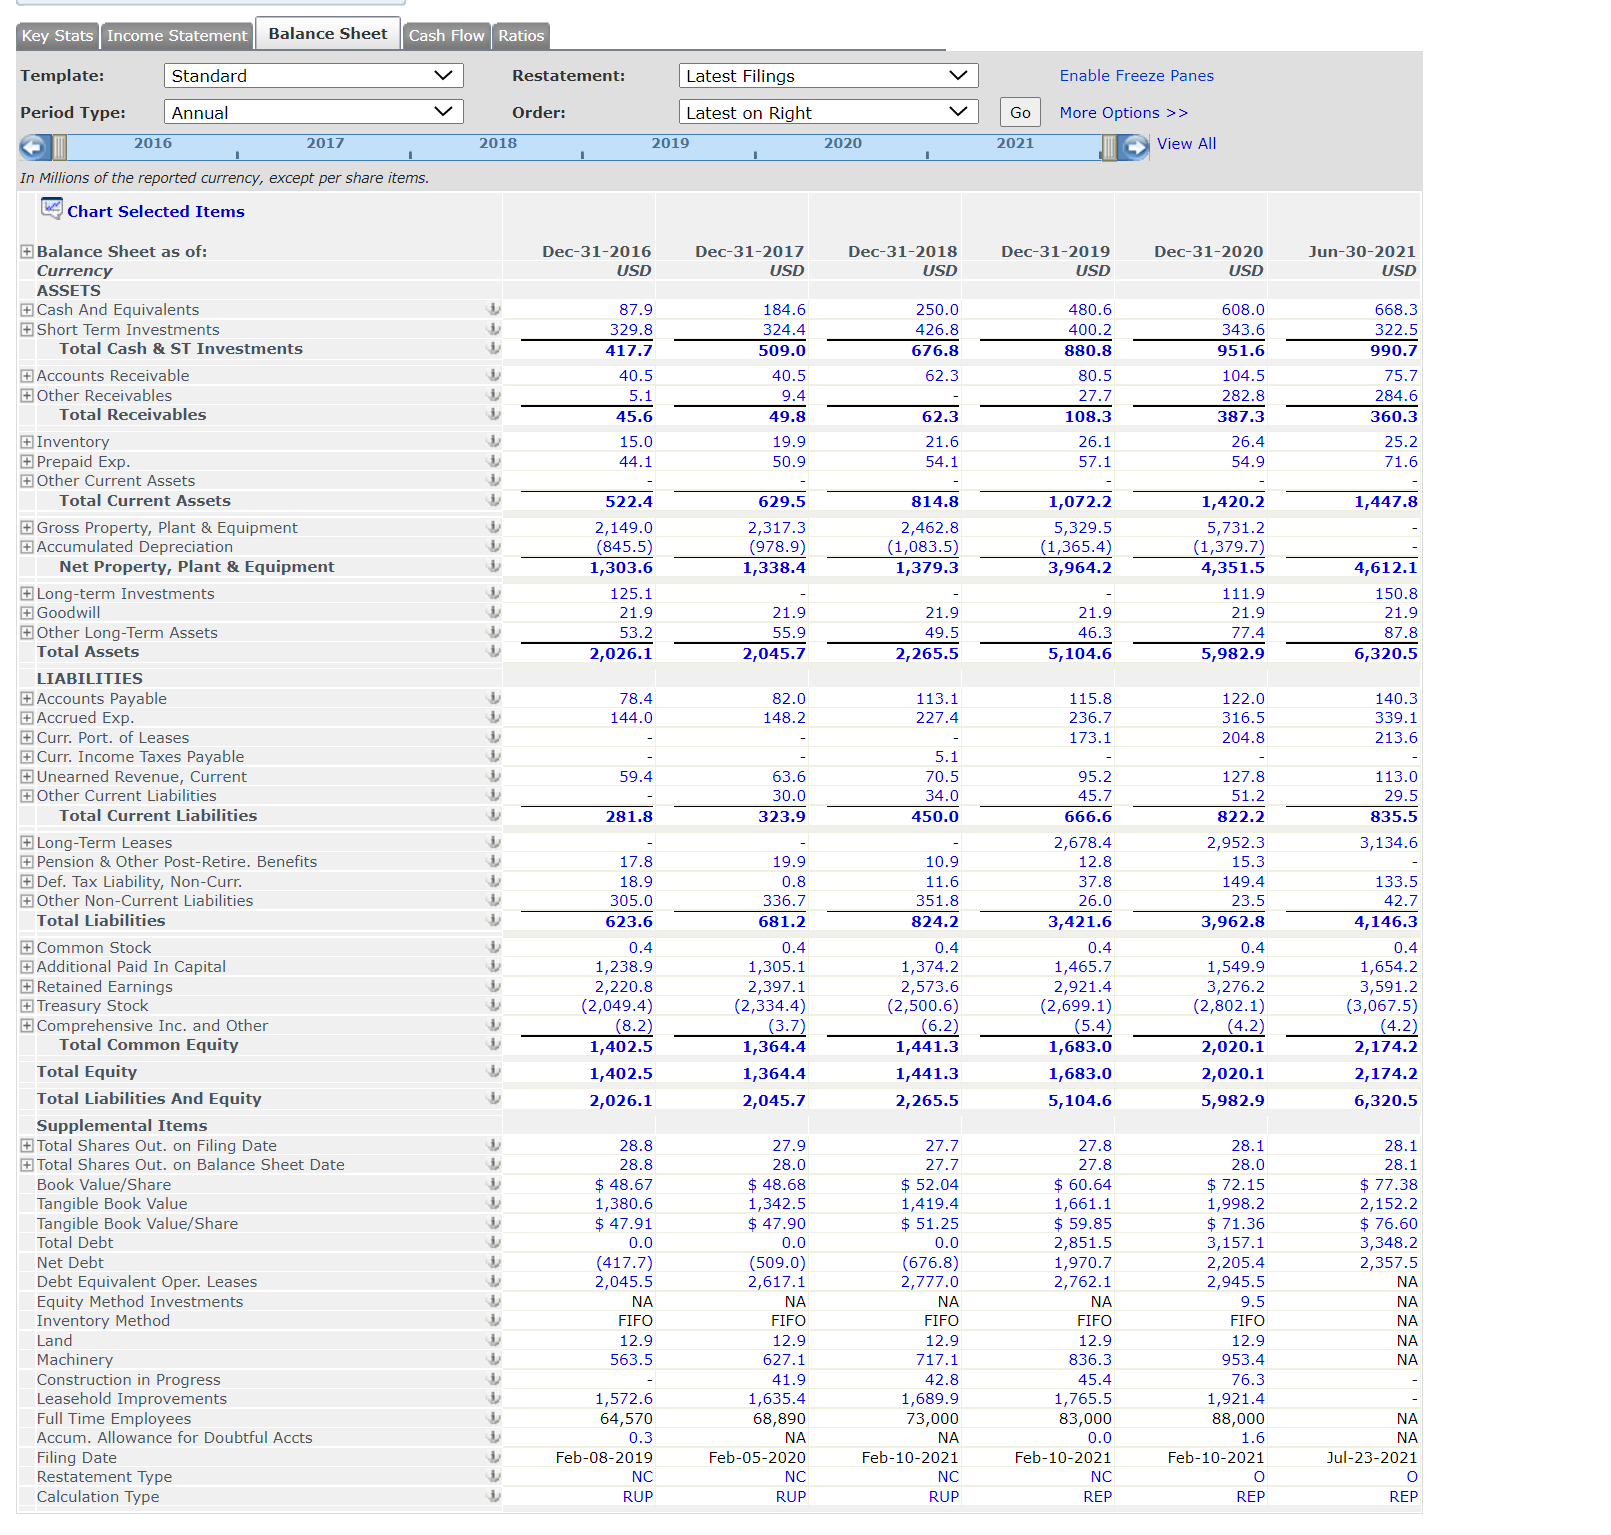
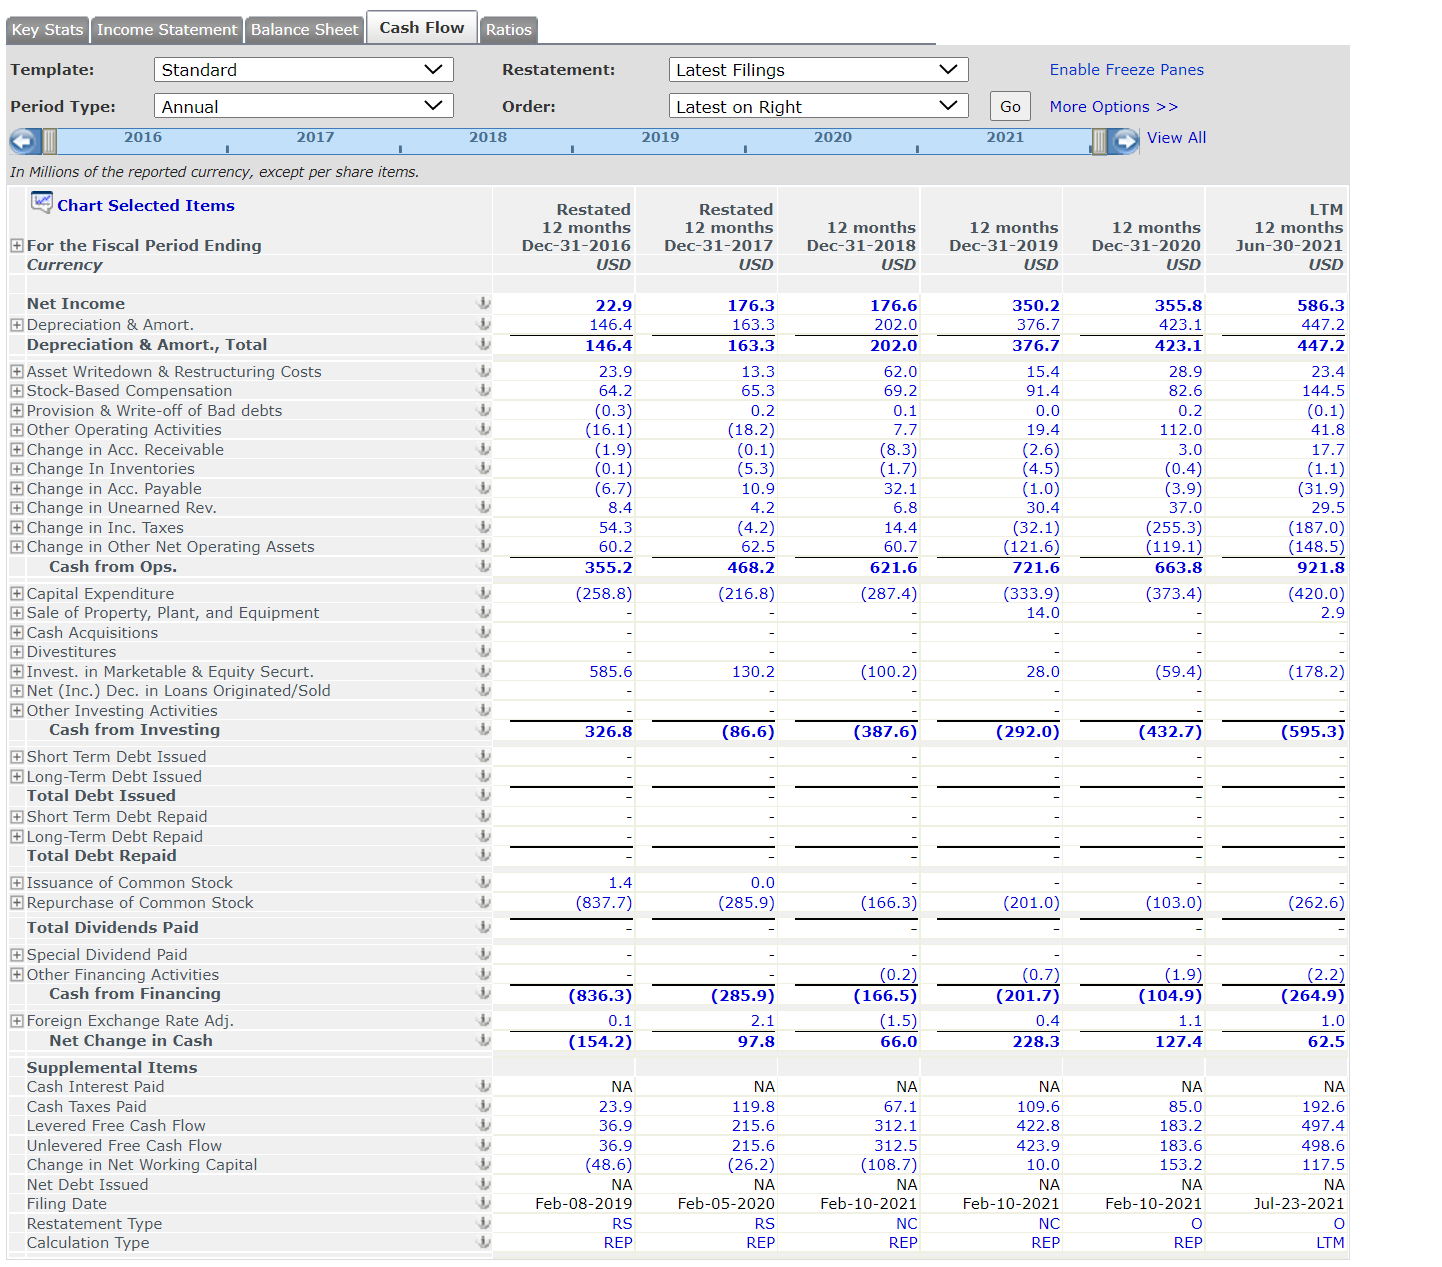
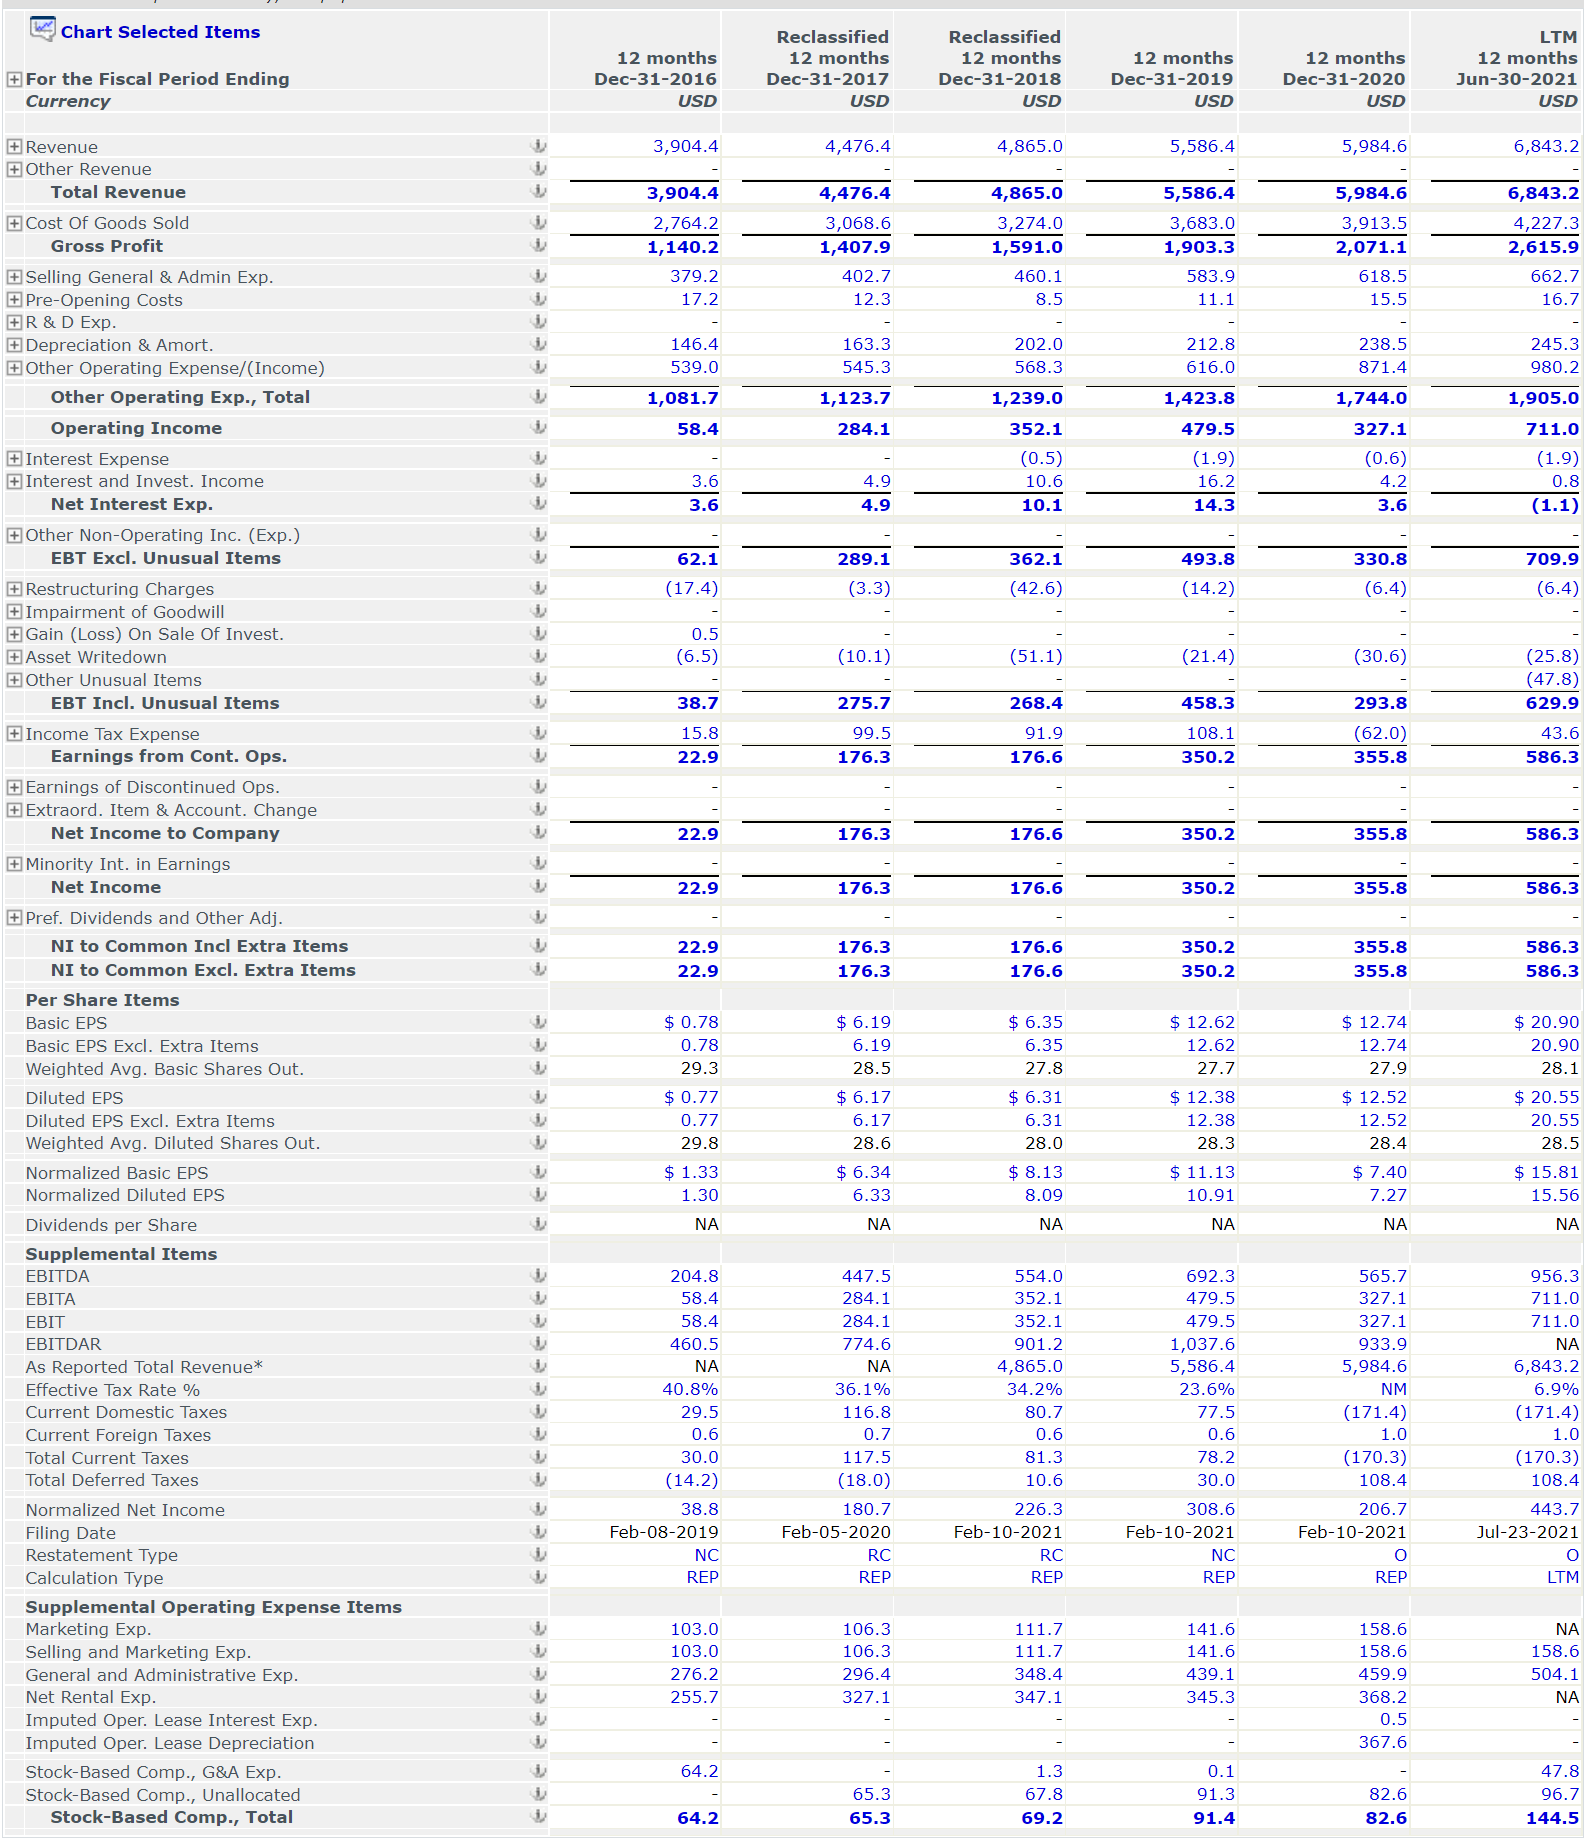
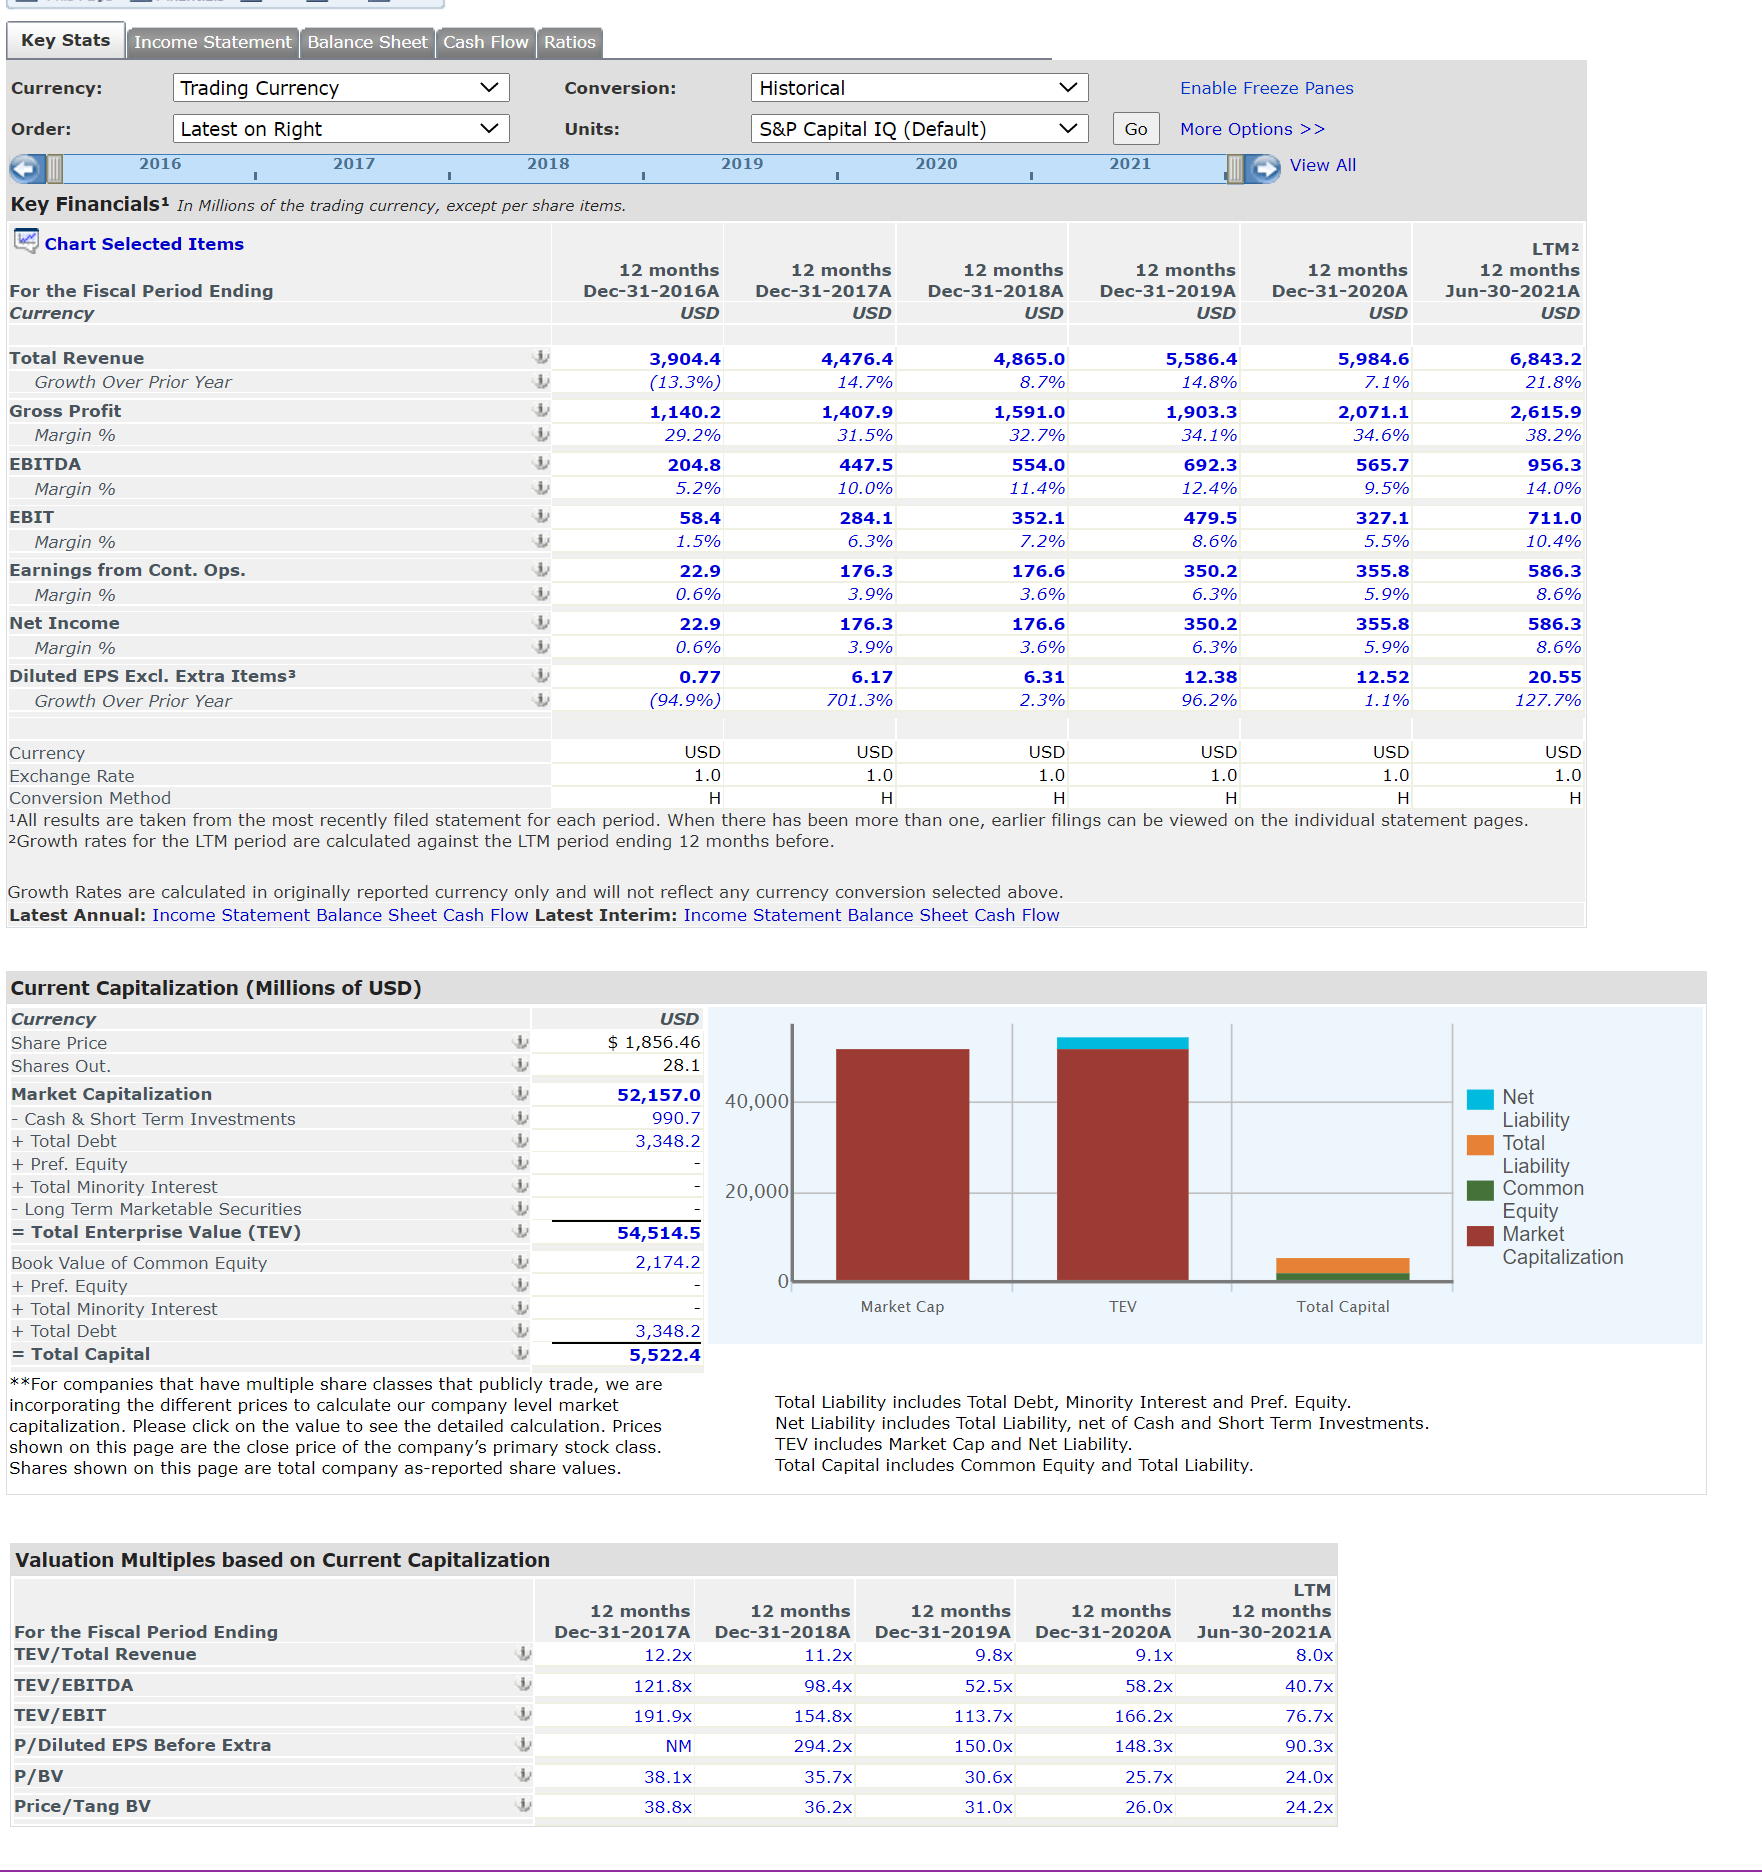
Analysis: (use Excel to complete this section) 50. 51. 52. Provide common-size analysis of your company's income statement and balance sheet for the 2 most recent years (must be done using Excel with formulas). Provide horizontal analysis of your company's income statement and balance sheet, showing the dollar amount and percent of change using the 2 most recent years (you must use an Excel spreadsheet with formulas). Perform ratio analysis on your company using the ratios listed in Exhibit 13.16 on page 505 of your text (these must be in an Excel spreadsheet, using formulas to calculate the ratios). You should present them in a similar format as the text: group by category, list name of ratio, formula in words, and the ratio calculation. Give a short explanation of your conclusions about your company after each category of ratios (i.e. How liquid is your company? How efciently is it using its assets? etc.). Key Stats | Income Statement | Balance Sheet | Cash Flow | Ratios Template: Standard Restatement: Latest Filings Enable Freeze Panes Period Type: Annual Order: Latest on Right Go More Options > > 2016 2017 2018 2019 2020 2021 View All In Millions of the reported currency, except per share items. Chart Selected Items + Balance Sheet as of Dec-31-2016 Dec-31-2017 Dec-31-2018 Dec-31-2019 Dec-31-2020 Jun-30-2021 Currency USD USD USD USD USD USD ASSETS Cash And Equivalents 87.9 184.6 250.0 480.6 08.0 668.3 + Short Term Investments 329.8 324.4 426.8 400.2 343.6 322.5 Total Cash & ST Investments 509.0 676.8 880.8 951.6 990,7 + Accounts Receivable 0.5 40.5 62.3 80.5 104.5 75.7 + Other Receivables 5.1 9.4 27.7 282.8 284.6 Total Receivables 45.6 19.8 62.3 .08.3 387.3 360.3 + Inventory 15.0 19.9 21.6 26.1 26.4 25.2 + Prepaid Exp. 4.1 54.1 57.1 71.6 + Other Current Assets Total Current Assets 522.4 629.5 814.8 1,072.2 1,420.2 1,447.8 + Gross Property, Plant & Equipment 2, 149.0 2,317.3 2,462.8 5 , 329.5 5 , 731 .2 + Accumulated Depreciation cee (845.5) 978.9) 1,083.5) 1,365.4) 1,379.7) Net Property, Plant & Equipment 1,303.6 1,338.4 1,379.3 3,964.2 4,351.5 4,612.1 [+ Long-term Investments 125.1 111.9 50.8 + Goodwill 21.9 21.9 21.9 21.9 21.9 21.9 + Other Long-Term Assets cee 53.2 55.9 49.5 46.3 77.4 87.8 Total Assets 2,026.1 2,045.7 2,265.5 5,104.6 5,982.9 6,320.5 LIABILITIES + Accounts Payable 78.4 82.0 113.1 15.8 122.0 140.3 + Accrued Exp. 144.0 148.2 227.4 236.7 316.5 339.1 + Curr. Port. of Leases 173.1 204.8 213.6 + Curr. Income Taxes Payable 5.1 + Unearned Revenue, Current 63.6 70.5 95.2 13.0 cece 59.4 27.8 + Other Current Liabilities 30.0 34.0 45.7 51.2 29.5 Total Current Liabilities 281.8 323.9 450.0 566.6 322.2 335.5 + Long-Term Leases ,678.4 2,952.3 3,134.6 + Pension & Other Post-Retire. Benefits 17.8 19.9 10.9 12.8 15.3 [+ Def. Tax Liability, Non-Curr. 18.9 08 11.6 37.8 149.4 .33.5 + Other Non-Current Liabilities 305.0 336./ 351.8 26.0 23.5 42.7 Total Liabilities 523.6 681.2 324.2 3,421.6 3,962.8 1,146.3 + Common Stock 0.4 0.4 0.4 0.4 0.4 0.4 + Additional Paid In Capital 1,238.9 1,305.1 1,374.2 ,465.7 1,549.9 1,654.2 + Retained Earnings 2,220.8 2,397.1 2,573.6 2,921.4 3,276.2 3,591.2 + Treasury Stock 2,049.4) 2,334.4) 2,500.6) 2,699.1) 2,802.1) 3,067.5) + Comprehensive Inc. and Other (8.2) (3.7) (6.2) (5.4) (4.2) (4.2 ) Total Common Equity 1,402.5 1,364.4 1,441.3 ,683.0 2,020.1 2,174.2 Total Equity 1 , 402.5 1,364.4 1, 441.3 1, 683.0 2 , 020 .1 2, 174.2 Total Liabilities And Equity 2,026.1 2,045.7 2,265.5 5,104.6 5,982.9 6,320.5 Supplemental Items + Total Shares Out. on Filing Date 28.8 27.9 21.1 27.8 78.1 28.1 + Total Shares Out. on Balance Sheet Date eeel 28.8 28.0 27.7 27.8 28.0 28.1 Book Value/Share $ 48.67 $ 48.68 6 52.04 $ 60.64 $ 72.15 $ 77.38 Tangible Book Value 1,380.6 1,342.5 1,419.4 1,661.1 1,998.2 2,152.2 Tangible Book Value/Share $ 47.91 $ 47.90 51.25 $ 59.85 $ 71.36 $ 76.60 Total Debt 0.0 0.0 0.0 2,851.5 3,157.1 3,348.2 cece Net Debt (417.7) (509.0) (676.8) 1,970.7 2,205.4 2,357.5 Debt Equivalent Oper. Leases 2,045.5 2,617.1 2,777.0 ,762.1 945.5 NA Equity Method Investments NA NA NA NA 05 NA Inventory Method FIFO FIFO FIFO FIFO FIFO NA Land 12.9 12.9 12.9 12.9 12.9 NA Machinery 563.5 627.1 717.1 336.3 53.4 NA ceceeceee Construction in Progress 41.9 42.8 45.4 76.3 Leasehold Improvements ,572. ,635.4 1,689.9 1,765.5 921.4 Full Time Employees 64,570 58,890 73,000 83,000 38,000 VA Accum. Allowance for Doubtful Accts 0.3 NA NA 0.0 1.6 NA Filing Date Feb-08-2019 Feb-05-2020 Feb-10-2021 Feb-10-2021 Feb-10-2021 Jul-23-2021 Restatement Type NC NC O ee Calculation Type UP UP RUP REP REP REPKey Stats | Income Statement | Balance Sheet Cash Flow Ratios Template: Standard Restatement: Latest Filings Enable Freeze Panes Period Type: Annual Order: Latest on Right V Go More Options > > 2016 2017 2018 2019 2020 2021 View All In Millions of the reported currency, except per share items. Chart Selected Items Restated Restated LTM 12 months 12 months 12 months 12 months 12 months 12 months + For the Fiscal Period Ending Dec-31-2016 Dec-31-2017 Dec-31-2018 Dec-31-2019 Dec-31-2020 Jun-30-2021 Currency USD USD USD USD USD USD Net Income 22.9 176.3 176.6 350.7 355.8 586.3 + Depreciation & Amort. 146.4 163.3 202.0 376.7 423.1 447.2 eee Depreciation & Amort., Total 146.4 163.3 202.0 376.7 123.1 147.2 + Asset Writedown & Restructuring Costs 23.9 13.3 62.0 15.4 28.9 23.4 + Stock-Based Compensation 64.2 65.3 69.2 91.4 82.6 144.5 + Provision & Write-off of Bad debts (0.3) 0.2 0.1 0.0 0.2 (0.1) + Other Operating Activities (16.1) (18.2) 7.7 19.4 112.0 41.8 + Change in Acc. Receivable (1.9) (0.1) 8.3) (2.6) 3.0 17.7 + Change In Inventories (0.1) (5.3 ) (1.7) (4.5) (0.4) (1.1) + Change in Acc. Payable (6.7) 10.9 32.1 (1.0) (3.9) (31.9) + Change in Unearned Rev. 8.4 4.2 6.8 30.4 37.0 29.5 + Change in Inc. Taxes 54.3 (4.2) 14.4 (32.1) (255 . 3 ) (187.0) + Change in Other Net Operating Assets 60.2 62.5 60.7 (121.6) 119.1 148.5) Cash from Ops. 355.2 468.2 621.6 721.6 663.8 921.8 + Capital Expenditure (258.8) (216.8) (287.4) (333.9) (373.4) (420.0) + Sale of Property, Plant, and Equipment 14.0 2.9 + Cash Acquisitions + Divestitures + Invest. in Marketable & Equity Securt. 585.6 130.2 (100.2) 28.0 (59.4) (178.2) + Net (Inc. ) Dec. in Loans Originated/Sold + Other Investing Activities Cash from Investing 326.8 86.6) (387.6) (292.0) (432.7) (595.3) + Short Term Debt Issued + Long-Term Debt Issued Total Debt Issued + Short Term Debt Repaid + Long-Term Debt Repaid Total Debt Repaid + Issuance of Common Stock 1.4 0.0 + Repurchase of Common Stock 837.7) 285.9) 166.3) (201.0) (103.0) (262.6) Total Dividends Paid + Special Dividend Paid + Other Financing Activities (0.2) (0.7) (1.9) 2.2) Cash from Financing 836.3) (285.9) (166.5) (201.7) (104.9) (264.9) + Foreign Exchange Rate Adj. 0.1 2.1 (1.5) 0.4 1.1 1.0 Net Change in Cash (154.2) 97.8 66.0 228.3 127.4 62.5 Supplemental Items Cash Interest Paid NA NA NA NA NA NA Cash Taxes Paid 23.9 119.8 67.1 109.6 85.0 92.6 Levered Free Cash Flow 16.9 215.6 312.1 422.8 183.2 497.4 Unlevered Free Cash Flow 36.9 215.6 312.5 423.9 183.6 498.6 Change in Net Working Capital 48.6 26.2) 108.7) 10.0 153.2 17.5 Net Debt Issued NA NA NA NA NA NA Filing Date Feb-08-2019 Feb-05-2020 Feb-10-2021 Feb-10-2021 Feb-10-2021 Jul-23-2021 Restatement Type RS RS NC NC O O Calculation Type REP REP REP REP REP LTMChart Selected Items Reclassified Reclassified LTM 12 months 12 months 12 months 12 months 12 months 12 months + For the Fiscal Period Ending Dec-31-2016 Dec-31-2017 Dec-31-2018 Dec-31-2019 Dec-31-2020 Jun-30-2021 Currency USD USD USD USD USD USD + Revenue 3,904.4 4,476.4 4,865.0 5,586.4 5,984.6 6,843.2 + Other Revenue cee Total Revenue 3,904.4 4,476.4 4,865.0 5,586.4 5,984.6 6,843.2 + Cost Of Goods Sold 2,764.2 3,068.6 3,274.0 3,683.0 3,913.5 4,227.3 Gross Profit 1, 140.2 1,407.9 1,591.0 ,903.3 ,071.1 2,615.9 + Selling General & Admin Exp. eel 379.2 402.7 460.1 583.9 618.5 662.7 + Pre-Opening Costs 17.2 12.3 35 11.1 15.5 16.7 + R & D Exp. + Depreciation & Amort. 146.4 163.3 202.0 212.8 238.5 245.3 + Other Operating Expense/(Income) 539.0 545.3 $68.3 616.0 871.4 980 .2 Other Operating Exp., Total 1,081.7 1,123.7 1,239.0 1,423.8 1,744.0 1,905.0 Operating Income 58.4 284.1 352.1 479.5 327.1 711.0 + Interest Expense (0.5) 1.9) (0.6) (1.9) + Interest and Invest. Income 3.6 1.9 10.6 16.2 4.2 0.8 Net Interest Exp. 3 .6 4.9 10.1 14.3 3.6 (1.1) [+ Other Non-Operating Inc. (Exp.) EBT Excl Unusual Items 62.1 289. 362.1 493.8 330.8 709.9 + Restructuring Charges (17.4) (3.3) (42.6) (14.2) (6.4) (6.4 + Impairment of Goodwill + Gain (Loss) On Sale Of Invest. 0.5 + Asset Writedown (6.5) (10.1 (51.1) (21.4 (30.6) (25.8 + Other Unusual Items 47.8 EBT Incl. Unusual Items 38 .7 275.7 268.4 458.3 293.8 629.9 + Income Tax Expense 15.8 99.5 91.9 108.1 (62.0) 43.6 Earnings from Cont. Ops. 22.9 176.3 17.6 350.2 355.8 586.3 + Earnings of Discontinued Ops. + Extraord Item & Account. Change see Net Income to Company 22.9 176.3 176.6 350.2 355.8 586.3 + Minority Int. in Earnings Net Income 22.9 176.3 176.6 350.2 355.8 586.3 [+ Pref. Dividends and Other Adj. NI to Common Incl Extra Items 22.9 176.3 176.6 350.2 355. 586. lee NI to Common Excl Extra Items 22.9 176.3 176.6 350.2 355.8 586.3 Per Share Items Basic EPS ce $ 0.78 $ 6.19 $ 6.35 $ 12.62 $ 12.74 $ 20.90 Basic EPS Excl Extra Items 0.78 6.19 6.35 12.62 12.74 20.90 Weighted Avg. Basic Shares Out. 29.3 28.5 27.8 27.7 27.9 28 . 1 Diluted EPS eel $ 0.77 $ 6.17 $ 6.31 $ 12.38 $ 12.52 $ 20.55 Diluted EPS Excl Extra Items 0.77 6.17 6.31 12.38 12.52 20.55 Weighted Avg. Diluted Shares Out. 29.8 28.6 28.0 28.3 28.4 28.5 Normalized Basic EPS $ 1.33 $ 6.34 $ 8.13 $ 11.13 : 7.40 $ 15.81 Normalized Diluted EPS 1.30 6.33 8 09 10.91 727 15.56 Dividends per Share NA NA NA NA NA NA Supplemental Items EBITDA 204.8 447.5 $54. 192.3 565.7 956.3 EBITA 58.4 284 .1 352 .1 479.5 327.1 711.0 EBIT 58 .4 284.1 352 .1 479.5 327.1 711.0 EBITDAR 160.5 774.6 901.2 ,037.6 933.9 NA As Reported Total Revenue* NA NA ,865.0 5,586.4 5,984.6 6,843.2 Effective Tax Rate % 40.8% 36. 1% 34.2% 23.6% NM 6.9% Current Domestic Taxes 29.5 116.8 30.7 77.5 (171.4) (171.4) Current Foreign Taxes 0.6 0.7 0.6 0.6 1.0 1.0 Total Current Taxes cee 30.0 117.5 81.3 78.2 170.3) 170.3) Total Deferred Taxes 14.2) (18.0) 10.6 30.0 108.4 108.4 Normalized Net Income 38.8 180.7 226.3 308.6 206.7 443.7 Filing Date Feb-08-2019 Feb-05-2020 Feb-10-2021 Feb-10-2021 Feb-10-2021 Jul-23-2021 Restatement Type NC RC RC NC Calculation Type REP REP REP REP REP LTM Supplemental Operating Expense Items Marketing Exp. 103.0 106.3 111.7 141. 158.6 NA Selling and Marketing Exp. 103.0 106.3 111.7 141.6 158.6 158.6 General and Administrative Exp. 276.2 296.4 348.4 439.1 459.9 504.1 Net Rental Exp. eee 255.7 327. 347. 345.3 $68.2 NA Imputed Oper. Lease Interest Exp. 0 .5 Imputed Oper. Lease Depreciation 367.6 Stock-Based Comp., G&A Exp. 64.2 1.3 0.1 4/.8 eeel Stock-Based Comp., Unallocated 65.3 67.8 91.3 82.6 96.7 Stock-Based Comp., Total 64.2 65.3 69.2 91.4 82.6 144.5Key Stats Income Statement | Balance Sheet | Cash Flow | Ratios Currency Trading Currency Conversion: Historical Enable Freeze Panes Order: Latest on Right Units: S&P Capital IQ (Default) Go More Options > > 2016 2017 2018 2019 2020 2021 View All Key Financials1 In Millions of the trading currency, except per share items. wa Chart Selected Items LTM 2 12 months 12 months 12 months 12 months 12 months 12 months For the Fiscal Period Ending Dec-31-2016/ Dec-31-2017A Dec-31-2018A Dec-31-2019A Dec-31-2020A Jun-30-2021/ Currency USL USD USD USD USD USD Total Revenue 3,904.4 4,476.4 4,865.0 5,586.4 5,984.6 5,843.2 Growth Over Prior Year 13.3%) 14.7% 8.7% 14.0%% 7. 1% 21.8% Gross Profit 1,140.2 1,407.9 1,591. 1,903.3 2,071. 2,615.9 Margin % 29.2% 31.5% 32.7% 34.1% 34.6% 38.2% EBITDA ce 204.8 447.5 554.0 692.3 565.7 956.3 Margin % 5.2% 0.09 1 1.4% 12.4% 9.50% 14.0% EBIT 58. 284.1 352. 479.5 327.1 711.0 Margin % 1.5% 6.3% 7.2% 8.6% 5.5% 10.4% Earnings from Cont. Ops. 22.9 176.3 176.6 350.2 55.8 586.3 Margin % 0.6% 3.9% 3.6% 6.3% 5.9% 8.6% Net Income 22. 176.3 176.6 350.2 355.8 586.3 Margin % cecee 0.6% 3.9% 3.6% 6.3% 5.9% 8.6% Diluted EPS Excl Extra Items3 0.77 6.17 6.31 12.38 12.52 20.55 Growth Over Prior Year (94.9%) 701.3% 2.3% 96.5% 1. 1% 127.7% Currency USD JSD JSD USD USD JSD Exchange Rate 1.0 1.0 10 1.0 1.0 1.0 Conversion Method H H H All results are taken from the most recently filed statement for each period. When there has been more than one, earlier filings can be viewed on the individual statement pages. Growth rates for the LTM period are calculated against the LTM period ending 12 months before. Growth Rates are calculated in originally reported currency only and will not reflect any currency conversion selected above. Latest Annual: Income Statement Balance Sheet Cash Flow Latest Interim: Income Statement Balance Sheet Cash Flow Current Capitalization (Millions of USD) Currency USD Share Pric $ 1,856.46 Shares Out 28.1 Market Capitalization 52,157.0 40,000 Net - Cash & Short Term Investments 990.7 Liability + Total Debt 3,348.2 Total + Pref. Equity Liability + Total Minority Interest 20,000 Common Long Term Marketable Securities Equity = Total Enterprise Value (TEV) 54,514.5 Market Book Value of Common Equity 2,174.2 Capitalization + Pref. Equity + Total Minority Interest Market Cap TEV Total Capital + Total Debt 3,348.2 = Total Capital 5,522.4 **For companies that have multiple share classes that publicly trade, we are incorporating the different prices to calculate our company level market Total Liability includes Total Debt, Minority Interest and Pref. Equity. capitalization. Please click on the value to see the detailed calculation. Prices Net Liability includes Total Liability, net of Cash and Short Term Investments. shown on this page are the close price of the company's primary stock class. TEV includes Market Cap and Net Liability. Shares shown on this page are total company as-reported share values. Total Capital includes Common Equity and Total Liability. Valuation Multiples based on Current Capitalization LTM 12 months 12 months 12 months 12 months 12 months For the Fiscal Period Ending Dec-31-2017A Dec-31-2018A Dec-31-2019A Dec-31-2020A Jun-30-2021A TEV/Total Revenue 12.2X 1.2x 9.8X 9. 1x 8.0x TEV/ EBITDA 121.8x 98.4X 52.5x 58.2x 40.7x TEV/ EBIT 191.9x 154.8X 113.7x 166.2x 76.7x P/Diluted EPS Before Extra NM 294.2 150.0x 148.3 90.3x P/BV 38.1x 35.7x 30.6x 25.7x 24.0x Price/Tang BV 38.8> 36.2x 31.0x 26.0x 24.2x
Step by Step Solution
There are 3 Steps involved in it

Get step-by-step solutions from verified subject matter experts