

Question: I need help to understand this. The data sheet is the same in the question. Thank you in advanced. Kappa Designs, Inc. has the following
I need help to understand this. The data sheet is the same in the question. Thank you in advanced.
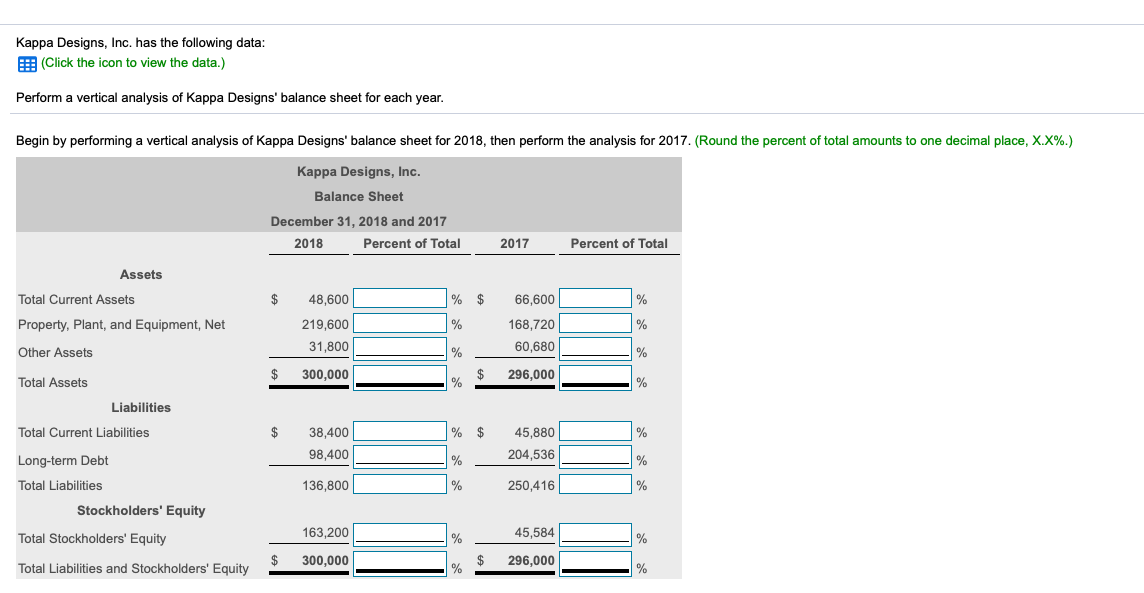
Kappa Designs, Inc. has the following data: (Click the icon to view the data.) Perform a vertical analysis of Kappa Designs' balance sheet for each year. Begin by performing a vertical analysis of Kappa Designs' balance sheet for 2018, then perform the analysis for 2017. (Round the percent of total amounts to one decimal place, X.X%.) Kappa Designs, Inc. Balance Sheet December 31, 2018 and 2017 2018 Percent of Total 2017 Percent of Total Assets Total Current Assets $ 48,600 % $ 66,600 % Property, Plant, and Equipment, Net 219,600 168,720 % Other Assets 31,800 % 60,680 % Total Assets $ 300,000 296,000 %% Liabilities Total Current Liabilities $ 38,400 $ 45,880 % Long-term Debt 98,400 % 204,536 % Total Liabilities 136,800 250,416 % Stockholders' Equity Total Stockholders' Equity 163,200 45,584 Total Liabilities and Stockholders' Equity $ 300,000 % $ 296,000 %
Step by Step Solution
There are 3 Steps involved in it

Get step-by-step solutions from verified subject matter experts