

Question: 1. (1 point) Please replicate the chart below using the cash flows given in the Excel template. (correct line and dots: 0.3; label X
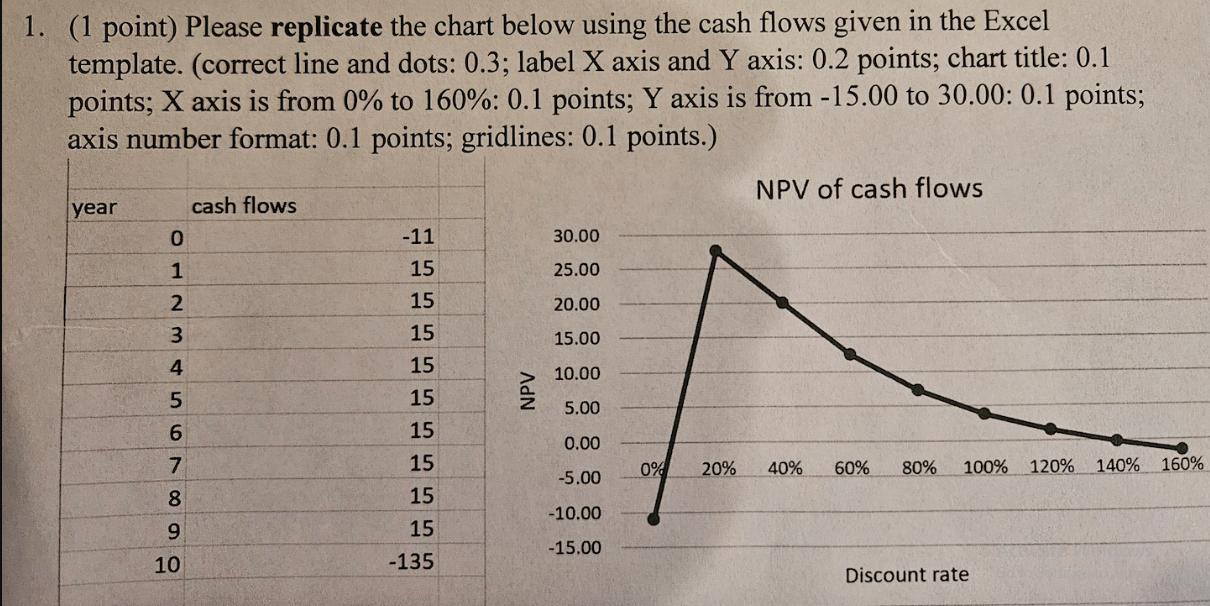
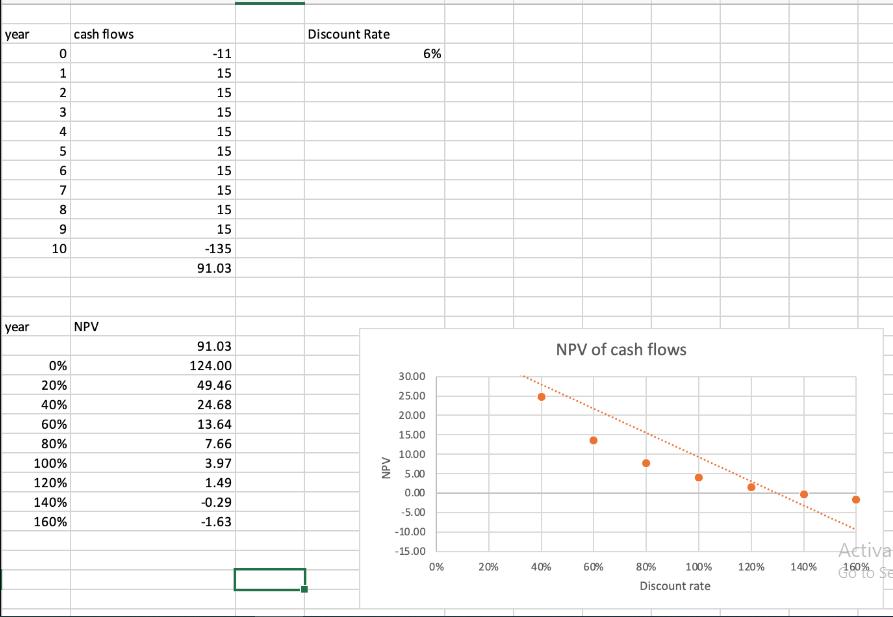
1. (1 point) Please replicate the chart below using the cash flows given in the Excel template. (correct line and dots: 0.3; label X axis and Y axis: 0.2 points; chart title: 0.1 points; X axis is from 0% to 160%: 0.1 points; Y axis is from -15.00 to 30.00: 0.1 points; axis number format: 0.1 points; gridlines: 0.1 points.) year 0 1 2 3 4 5 6 7 8 9 10 cash flows -11 15 15 15 15 15 15 15 15 15 -135 AdN 30.00 25.00 20.00 15.00 10.00 5.00 0.00 -5.00 -10.00 -15.00 NPV of cash flows 0% 20% 40% 60% 80% 100% 120% 140% 160% Discount rate year year 0 1 234 5 6 77949 8 10 0% 20% 40% 60% 80% 100% 120% 140% 160% cash flows NPV -11 15 15 15 15 15 15 15 15 15 -135 91.03 91.03 124.00 49.46 24.68 13.64 7.66 3.97 1.49 -0.29 -1.63 Discount Rate NPV 6% 30,00 25.00 20,00 15.00 10.00 5.00 0.00 -5.00 -10.00 -15.00 0% 20% 40% NPV of cash flows 60% 100% 80% Discount rate 120% 140% Activa 160% SE
Step by Step Solution
3.43 Rating (150 Votes )
There are 3 Steps involved in it
Answer To replicate the chart based on the given cash flows and NPV values follow these steps 1 Open ... View full answer

Get step-by-step solutions from verified subject matter experts