

Question: I need help understanding where i'm going doing wrong. For some of the questions they might seem long but they are pictured so everything is
I need help understanding where i'm going doing wrong. For some of the questions they might seem long but they are pictured so everything is included if needed. I need help understanding where i'm going wrong. Thank you
![Thank you 15. [3.4/3.57 Points] DETAILS PREVIOUS ANSWERS BBUNDERSTAT12 2.3.002.MI. MY NOTES](https://dsd5zvtm8ll6.cloudfront.net/si.experts.images/questions/2024/10/6709065b9d6b2_6996709065b70364.jpg)
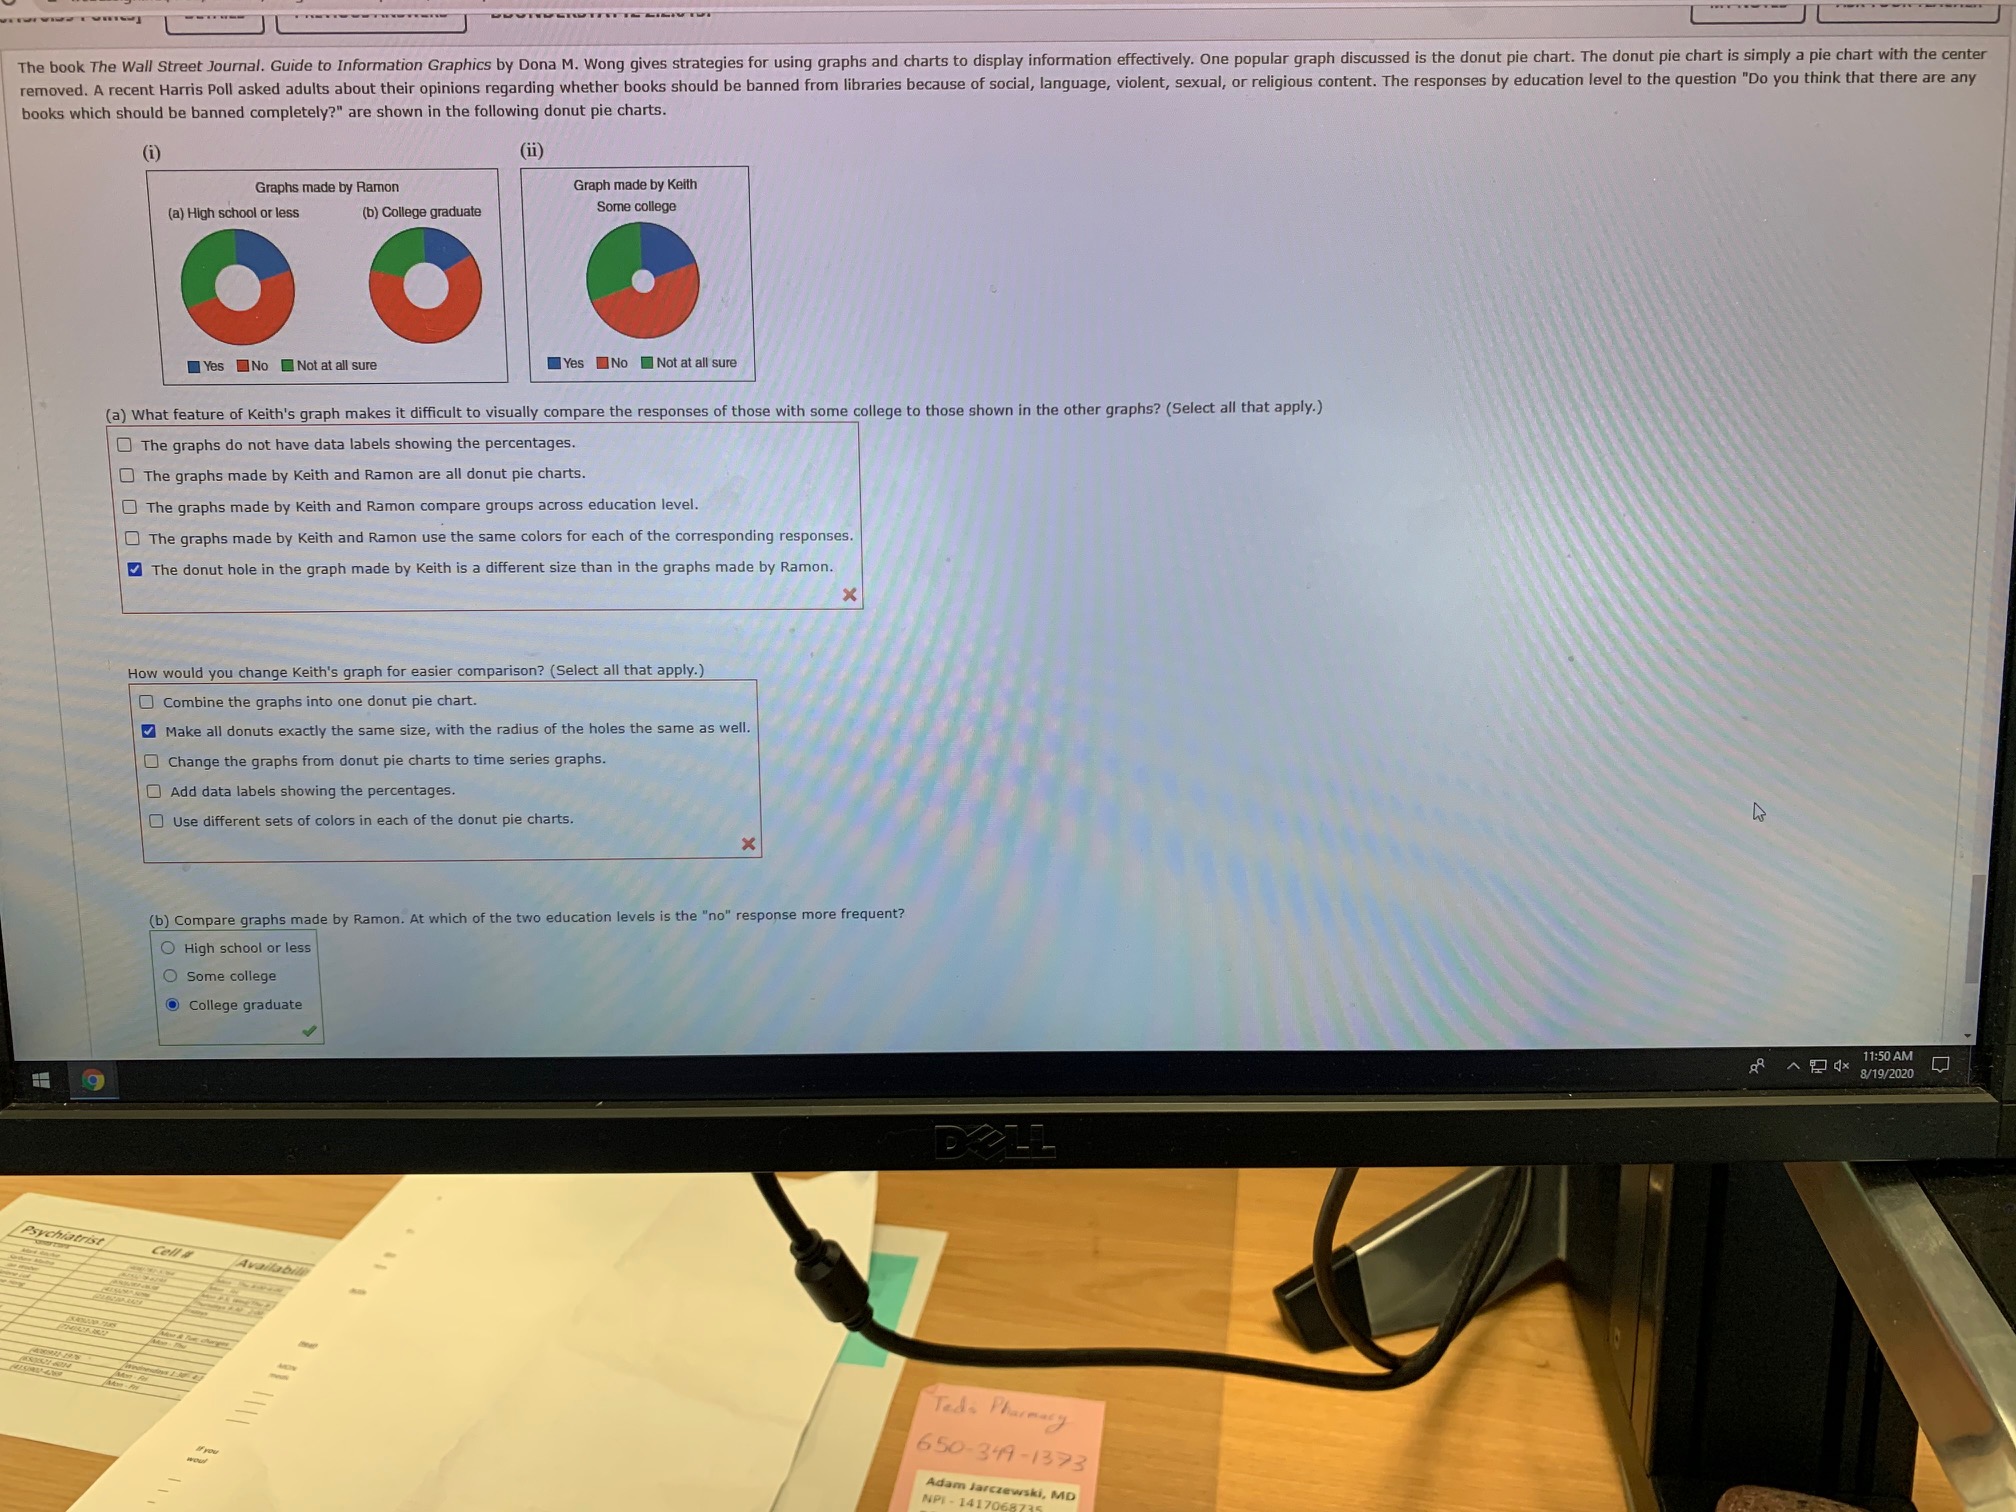
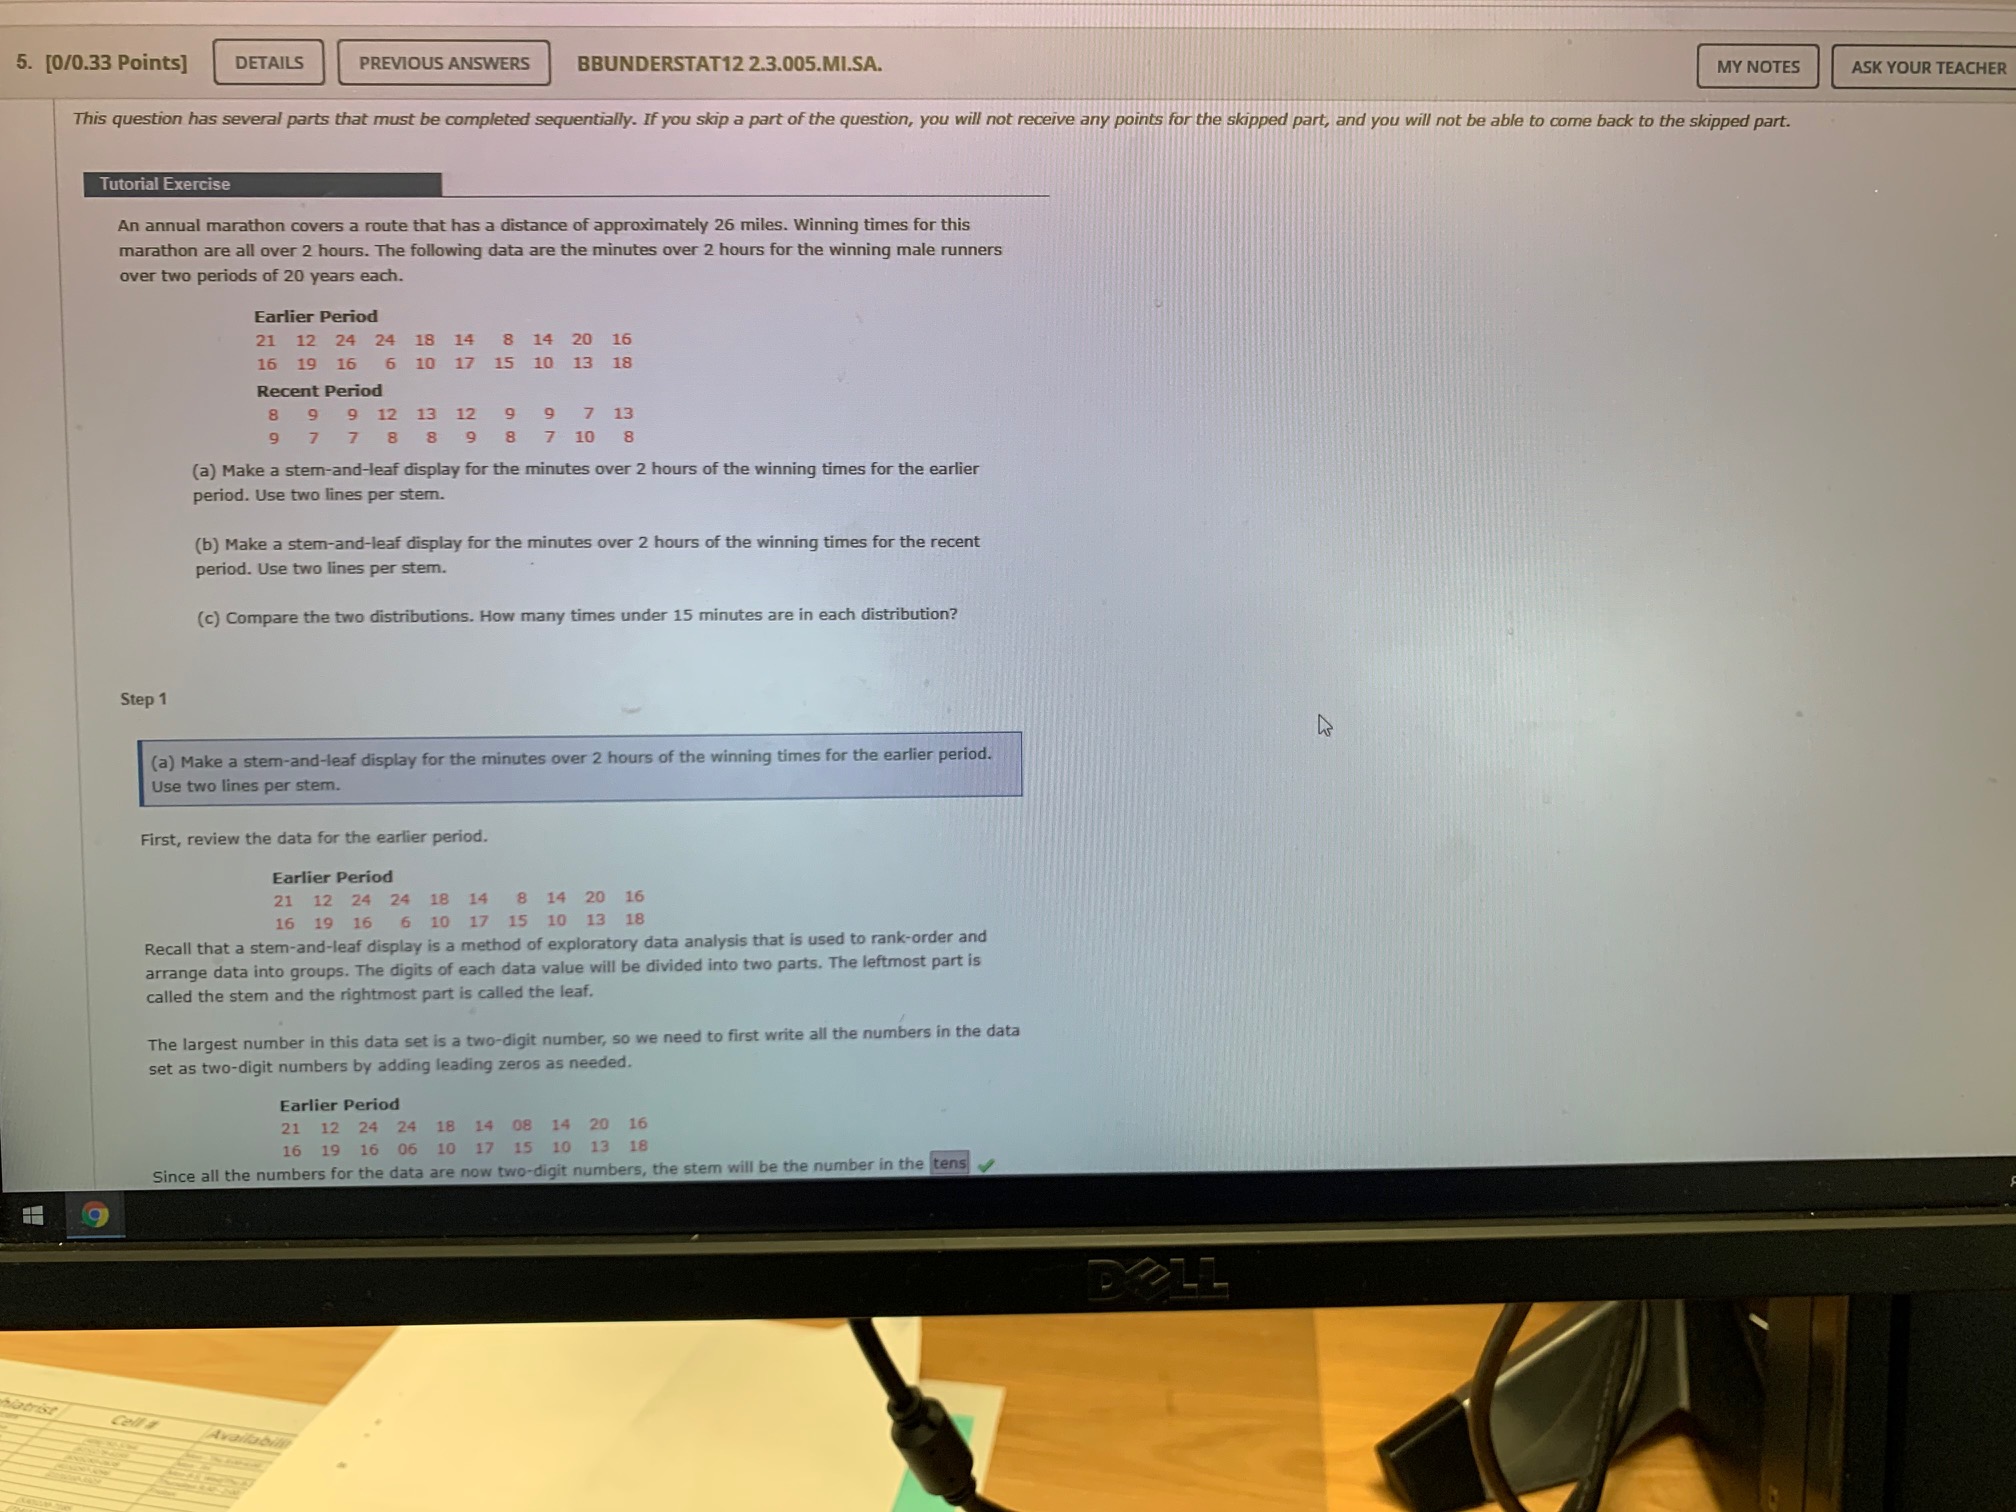
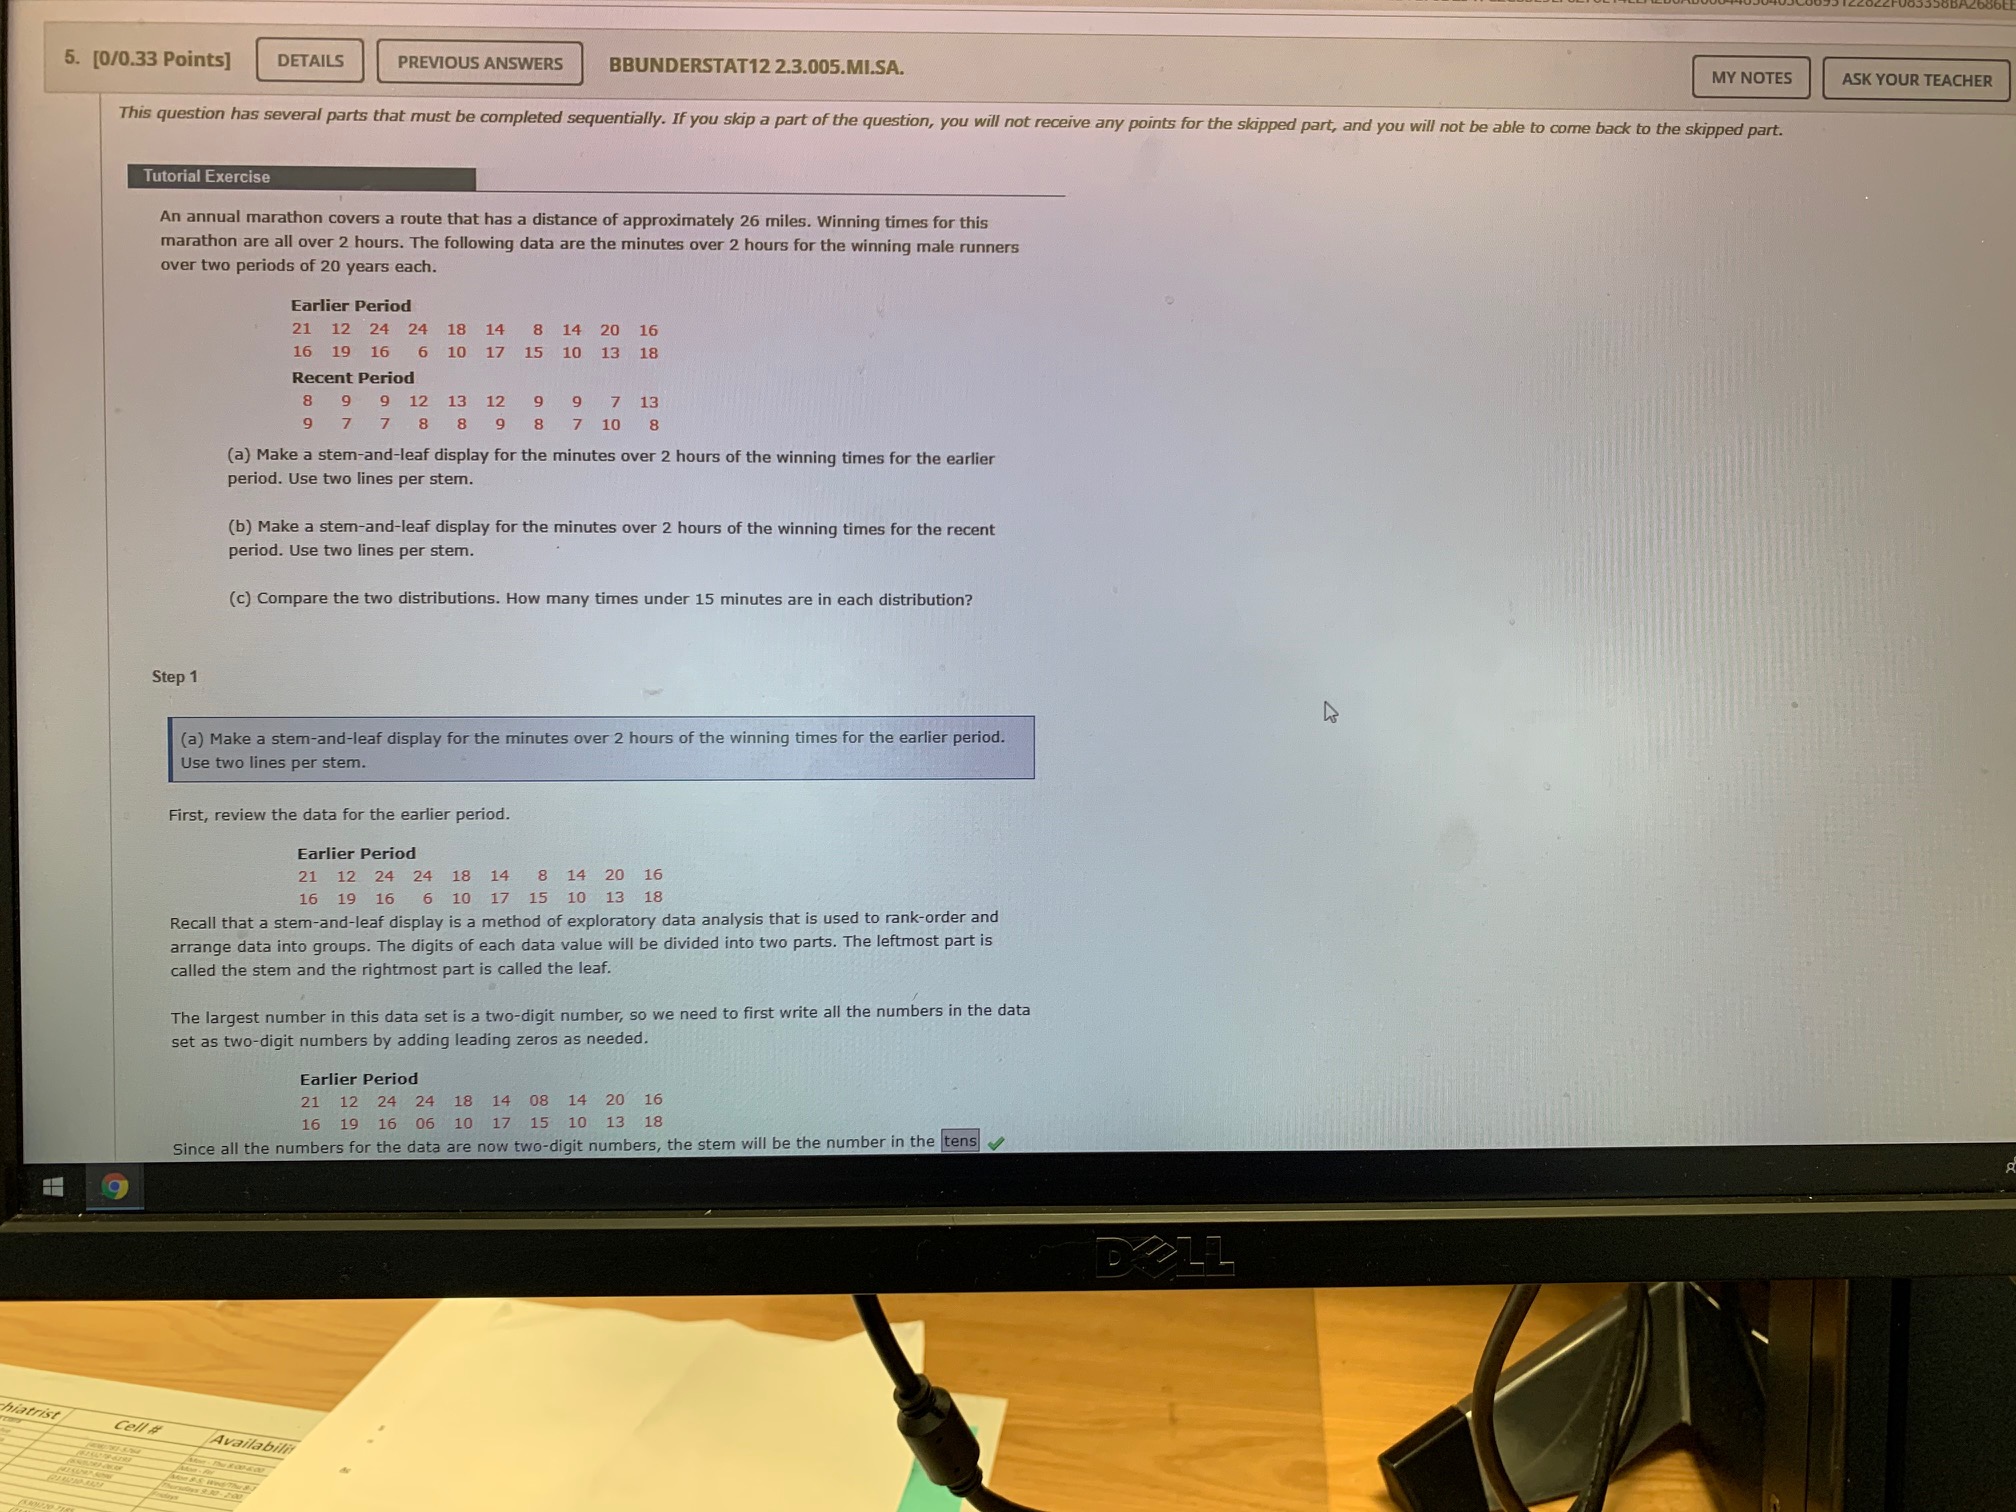
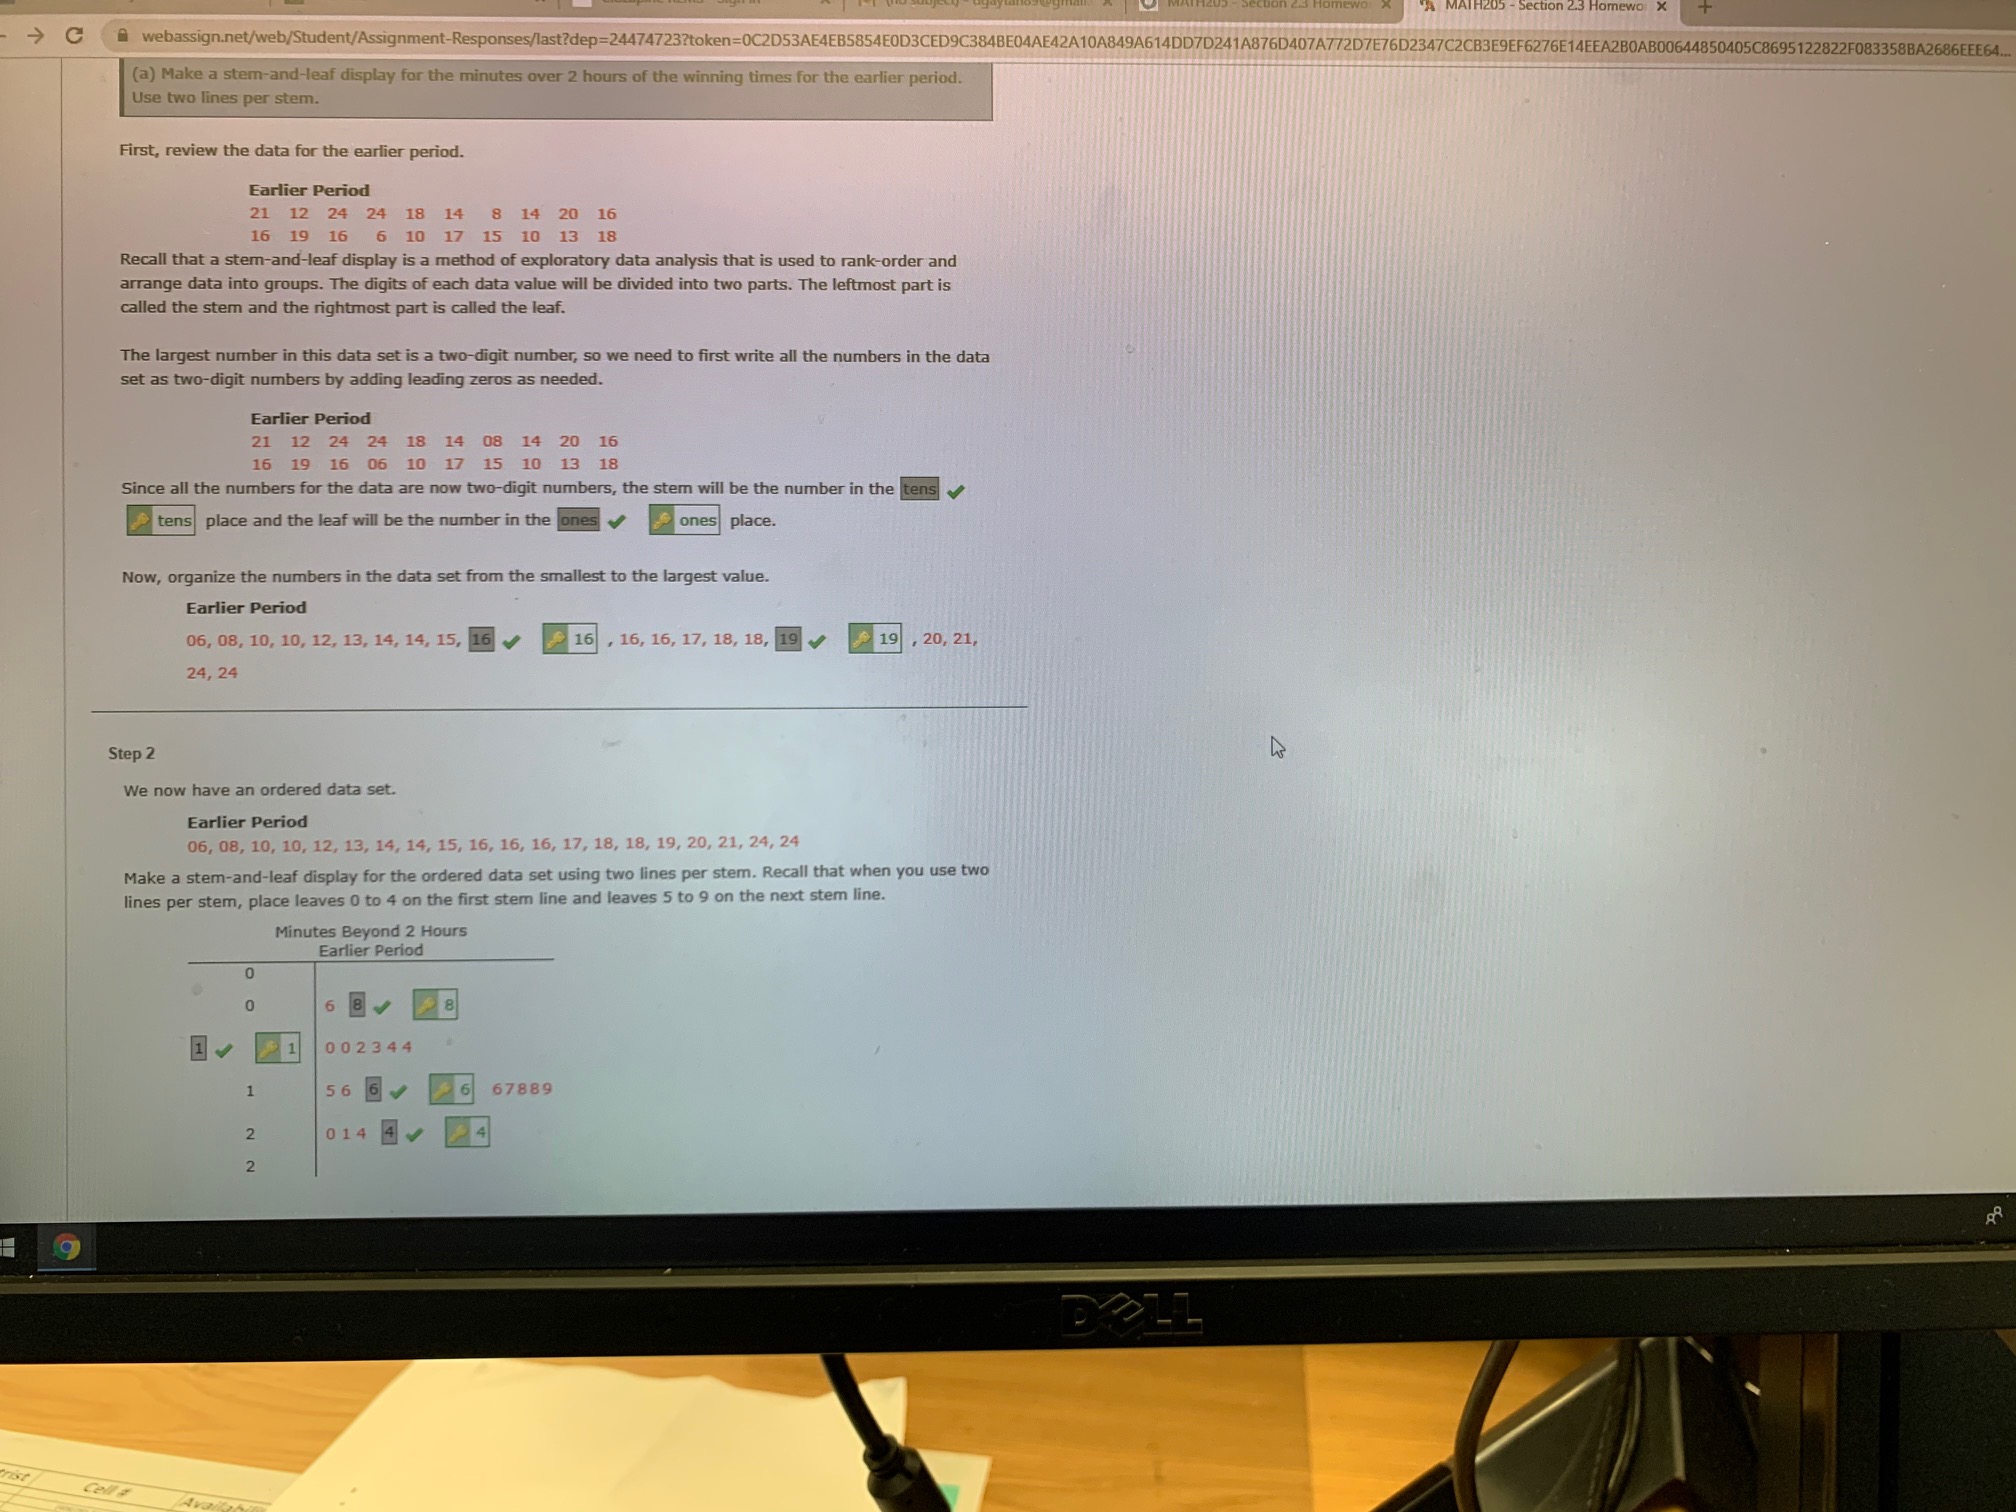
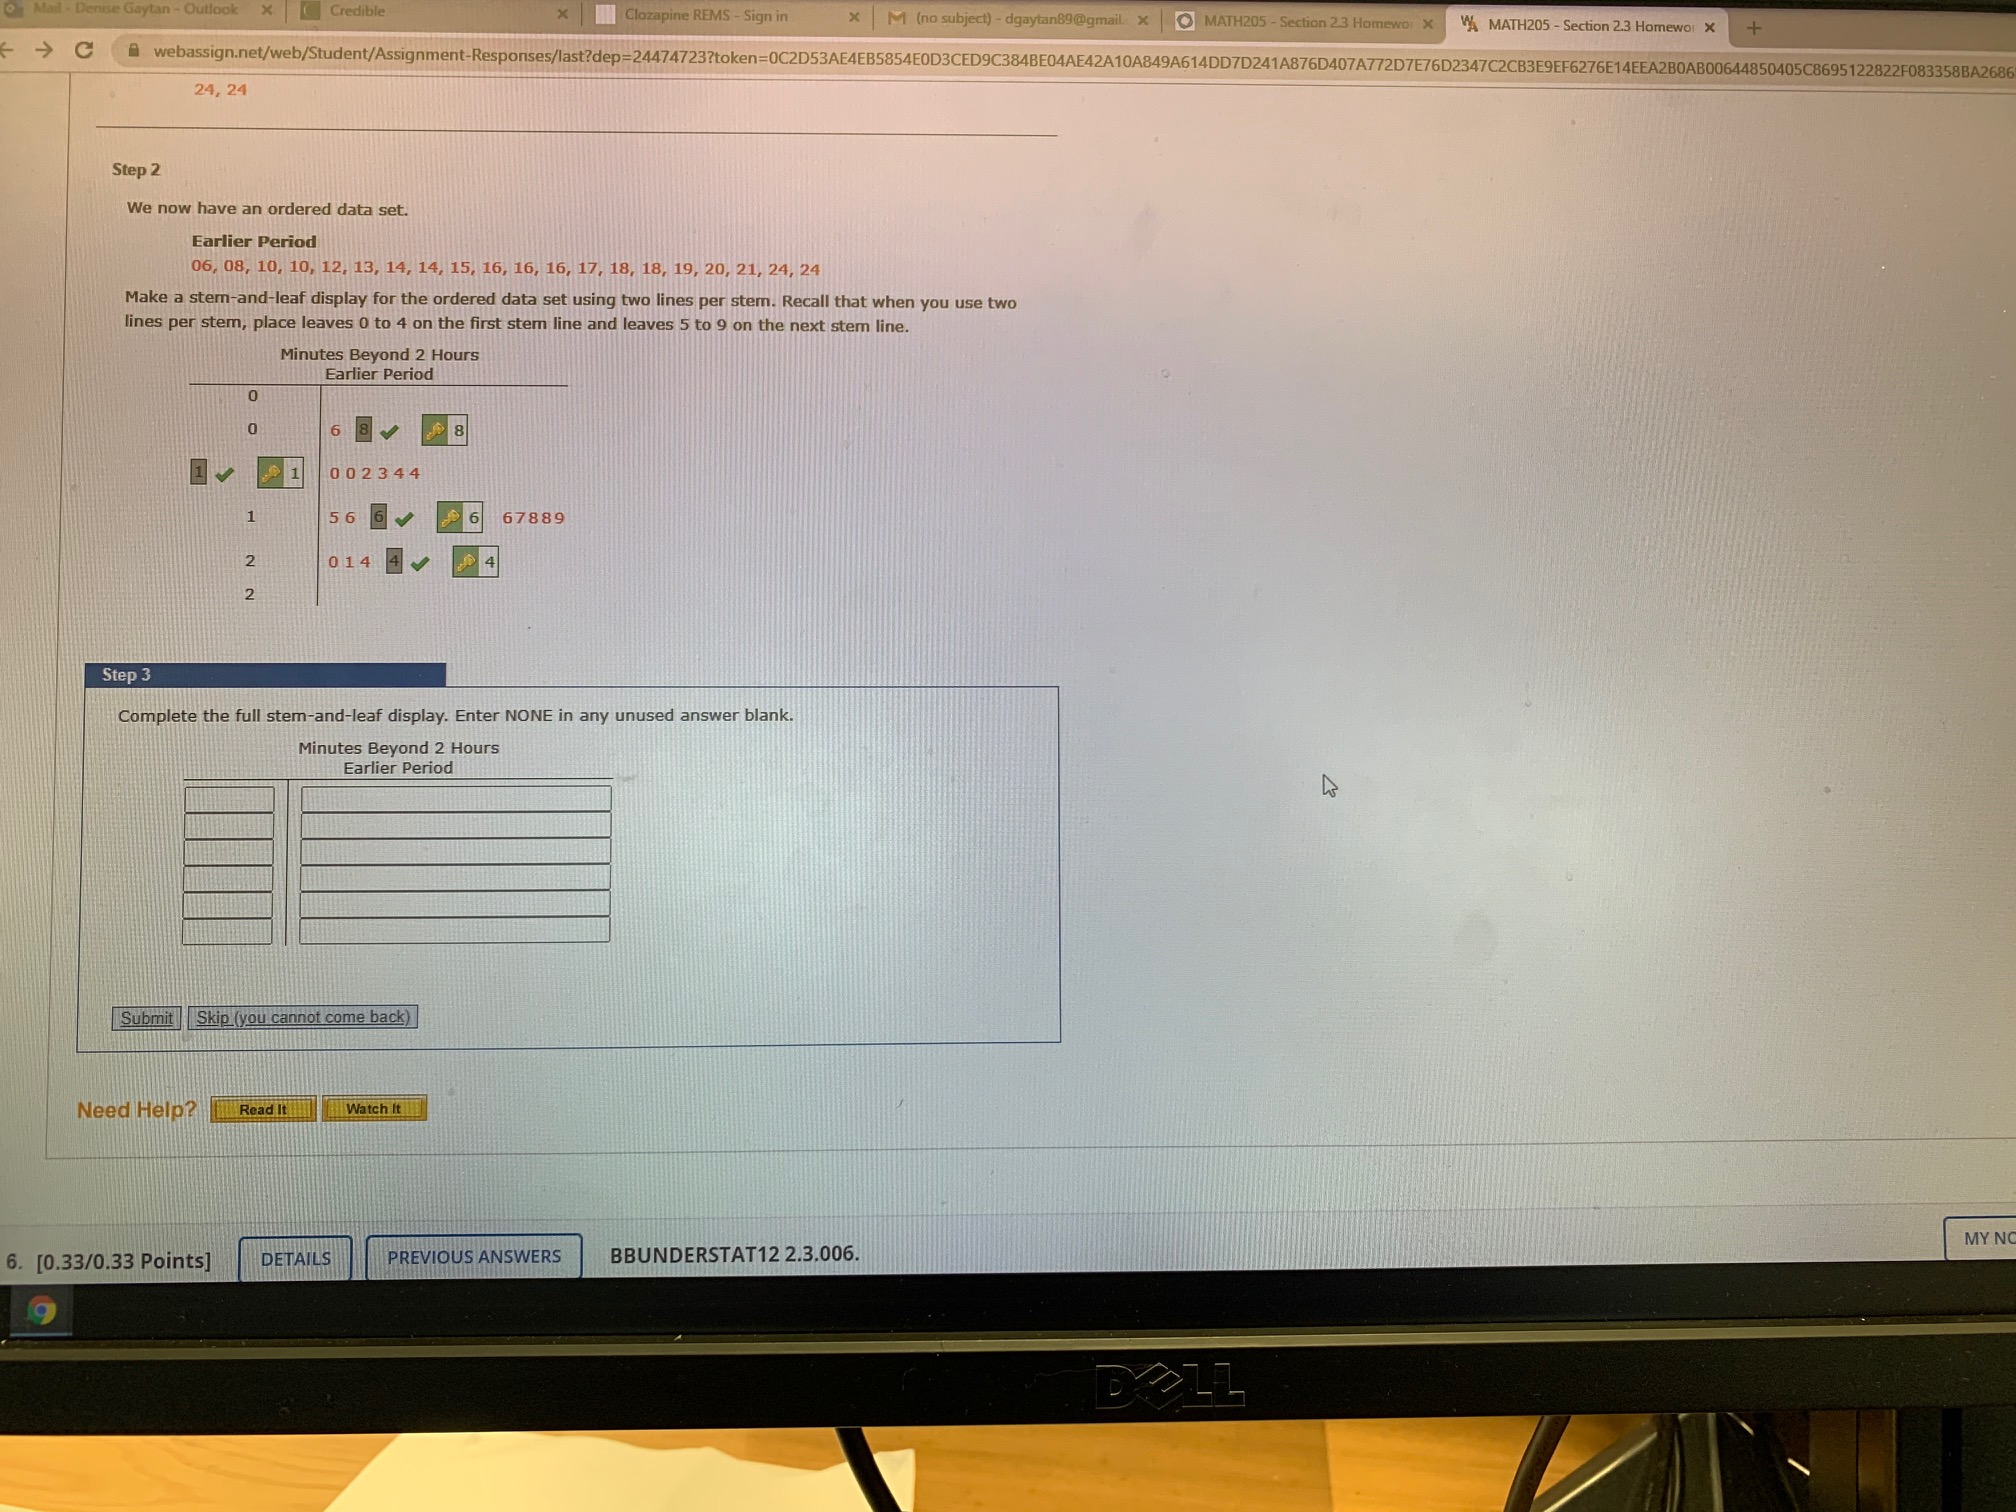
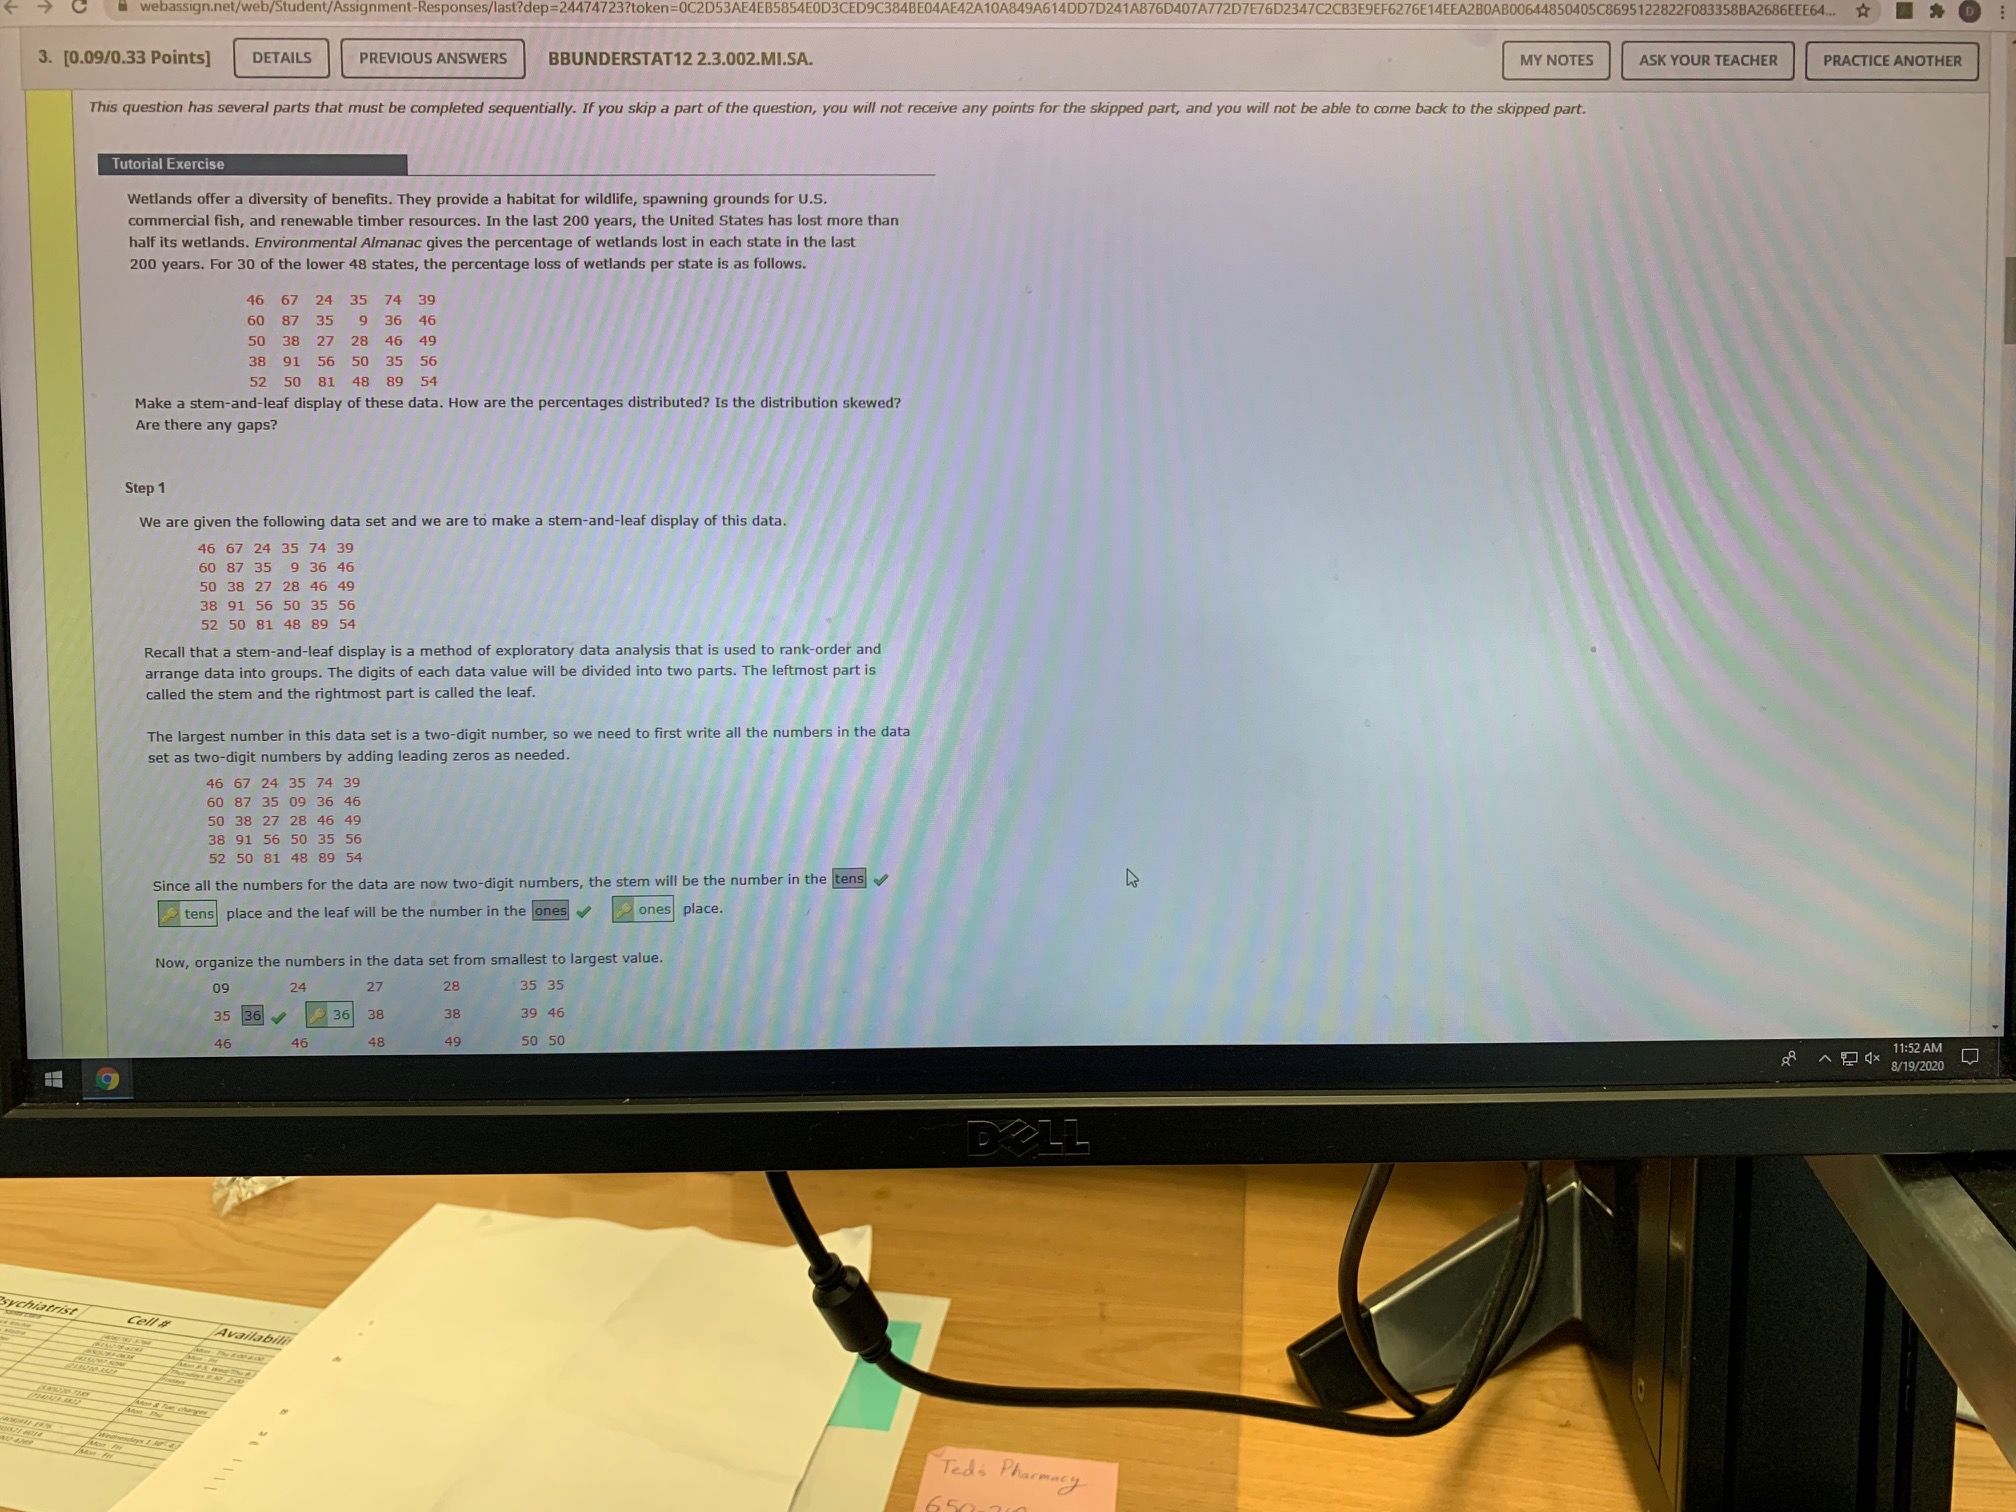
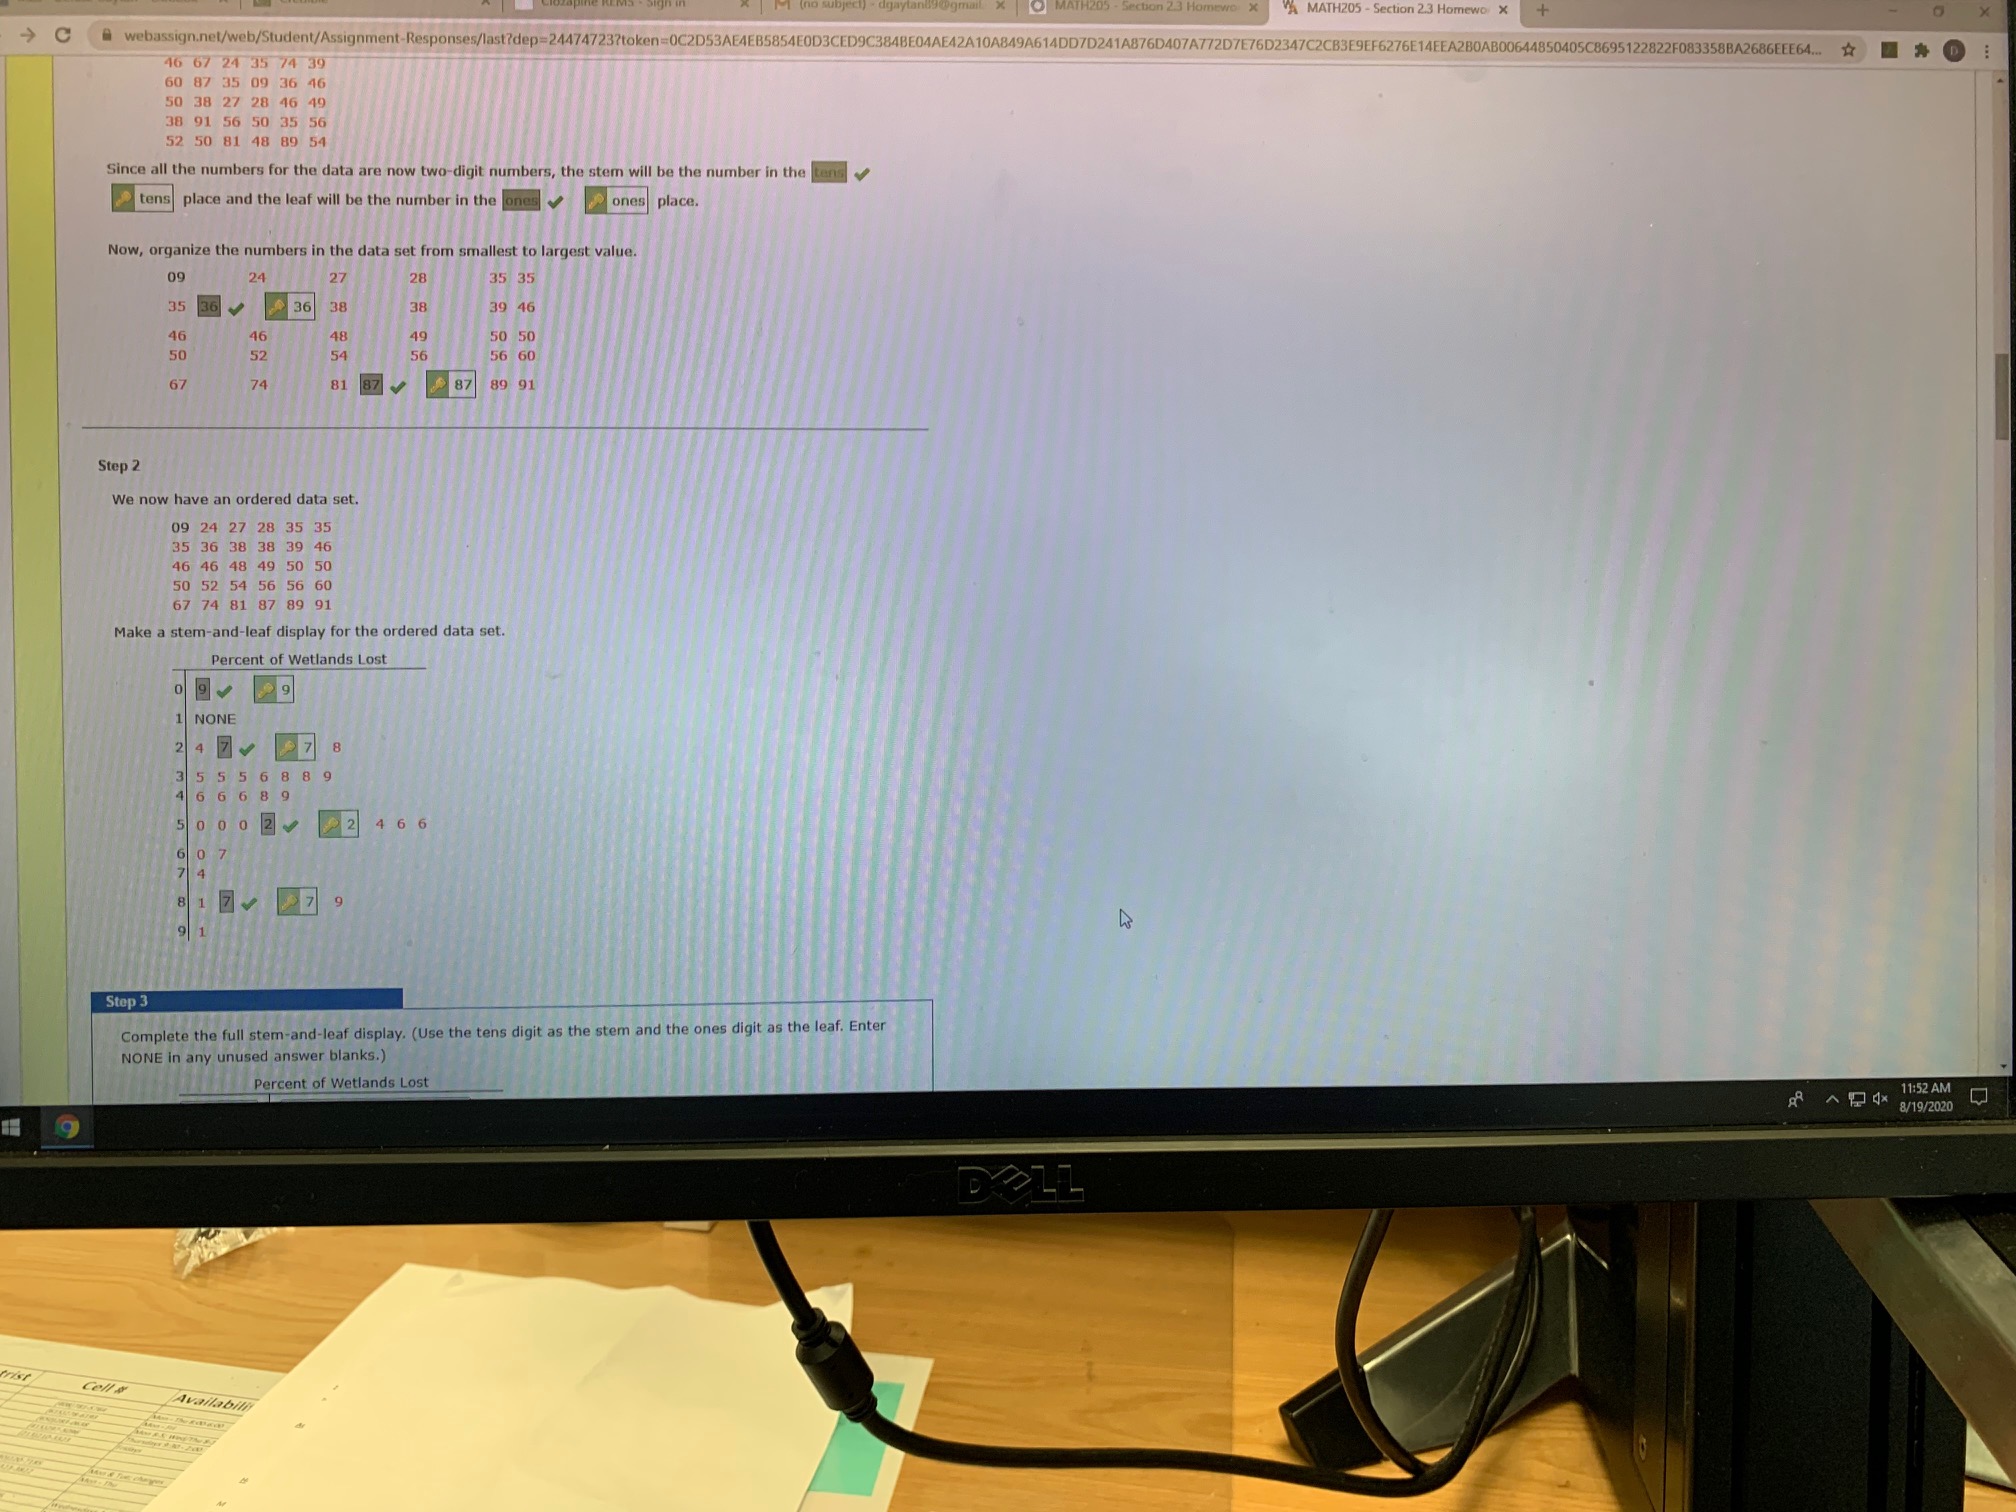
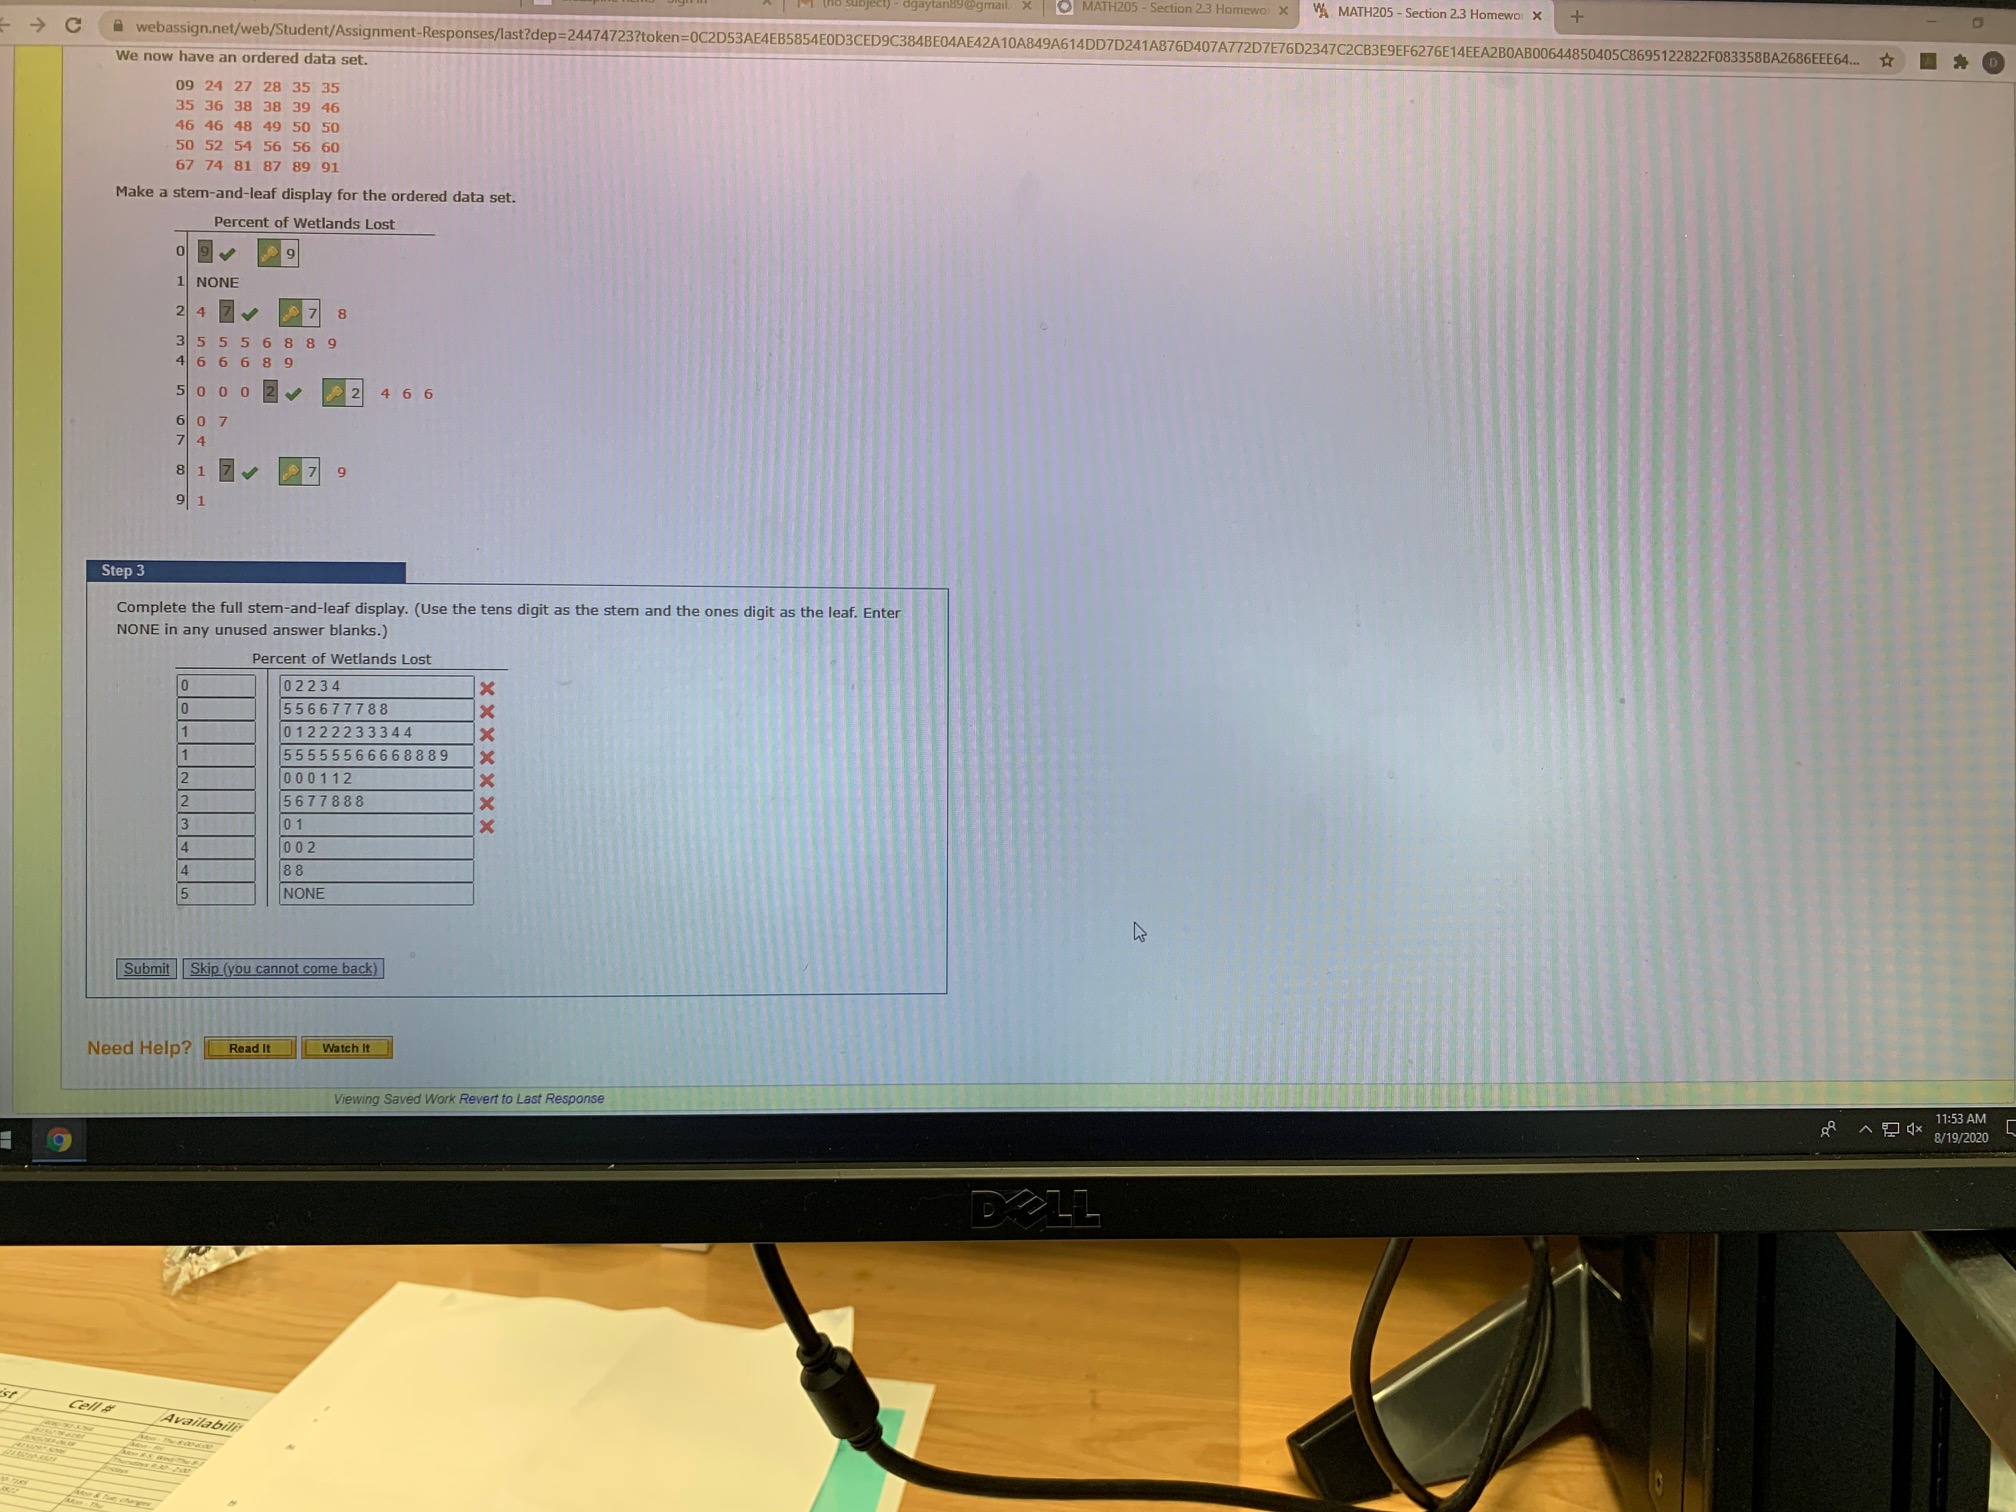
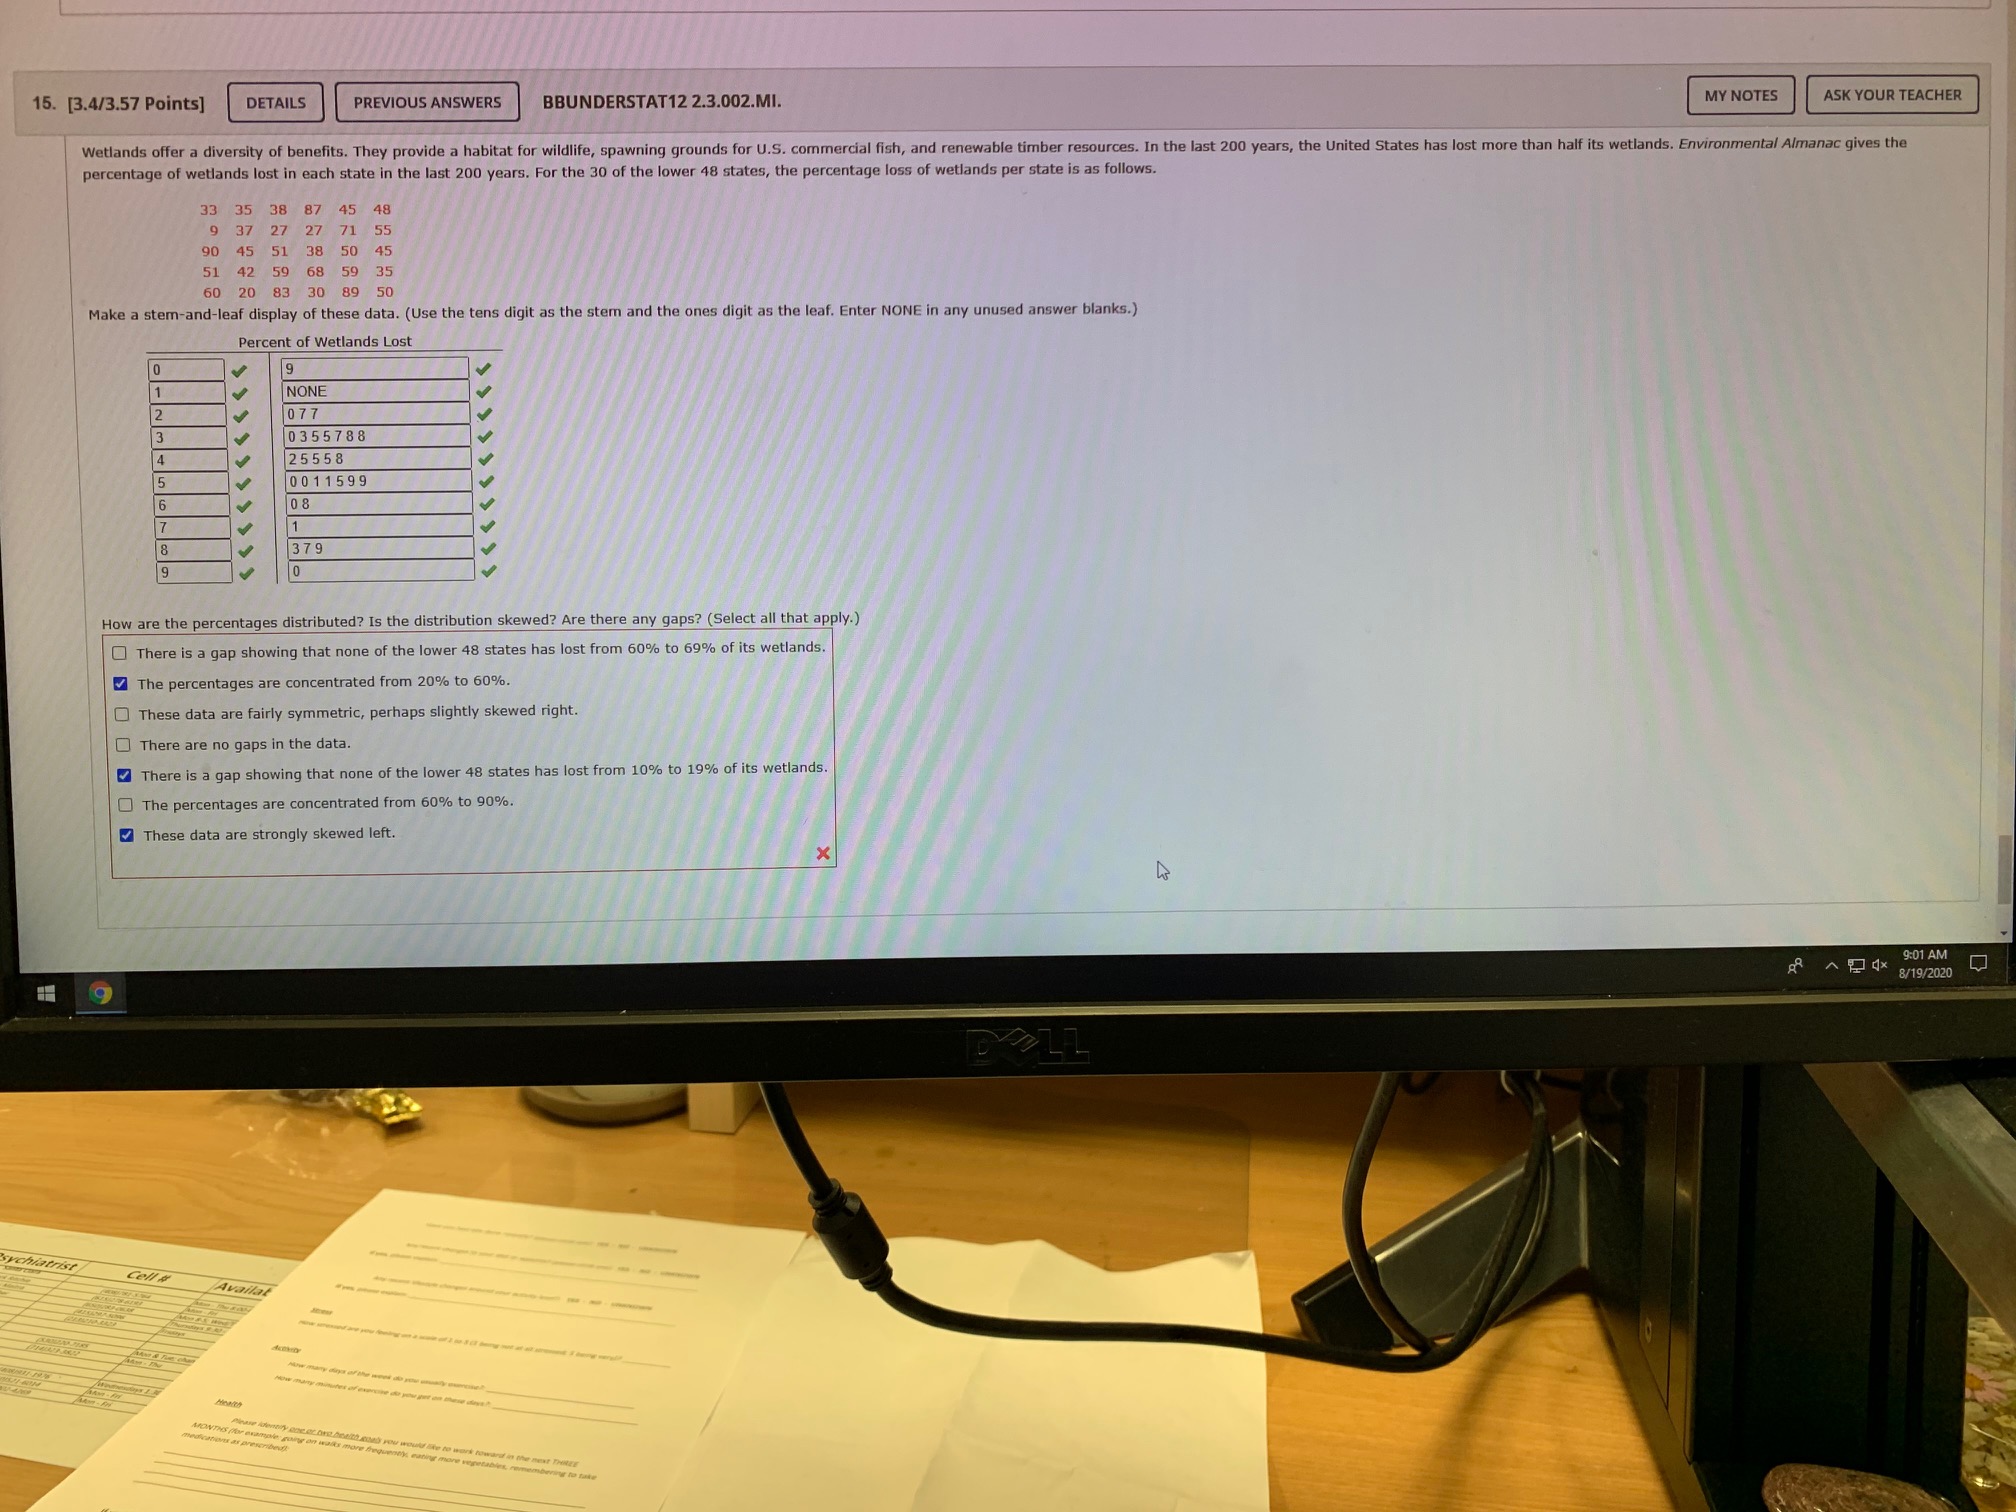
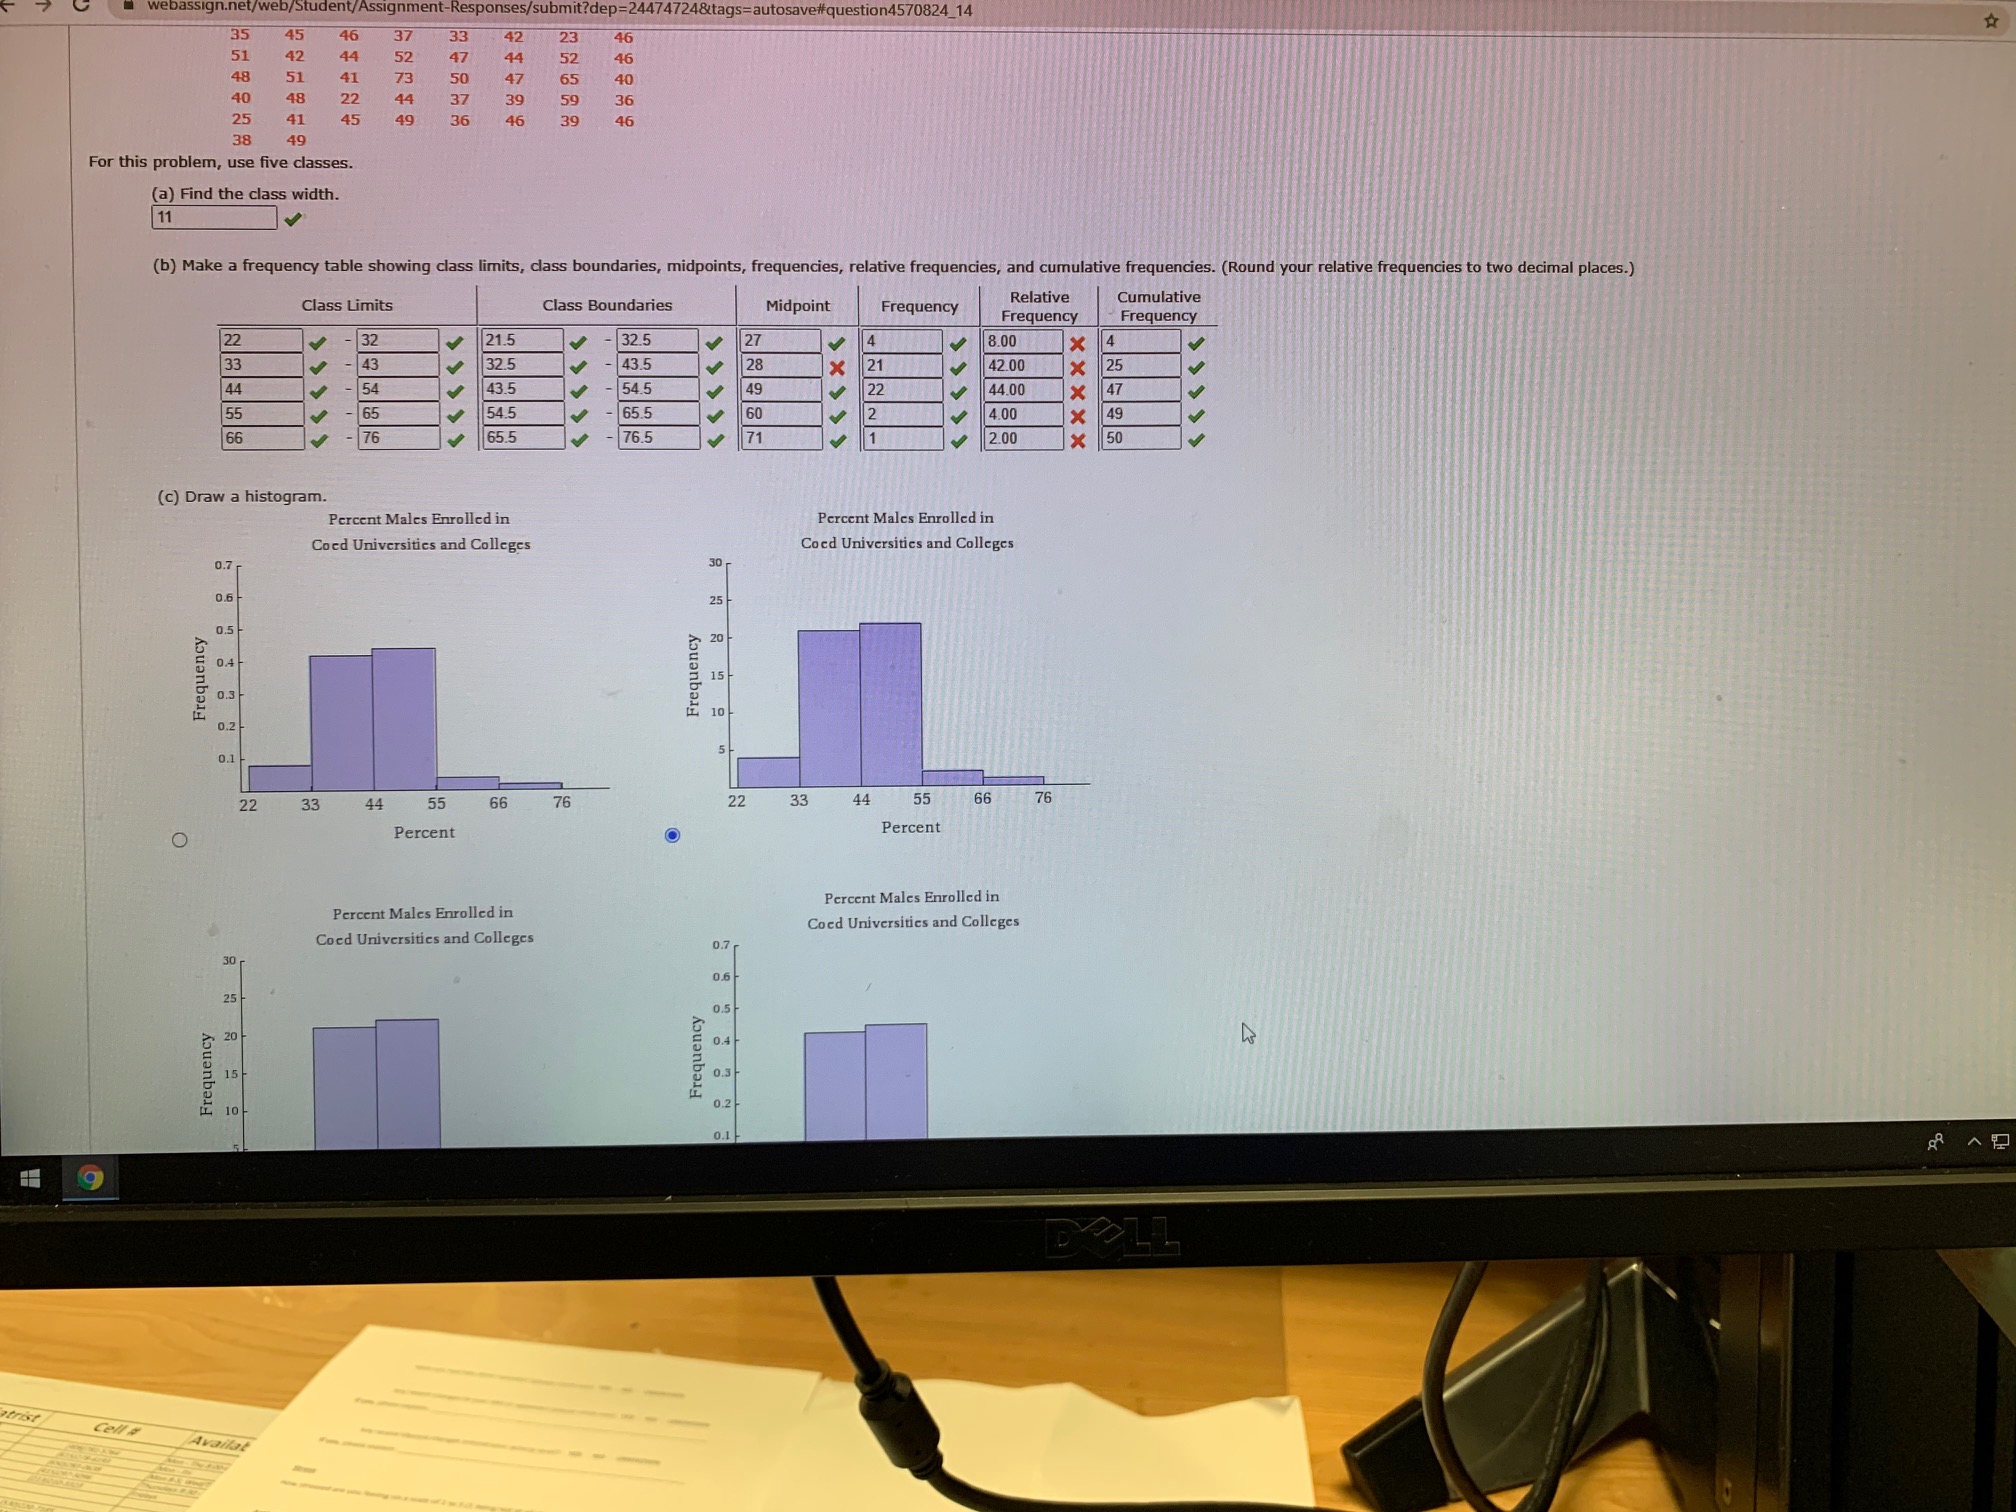
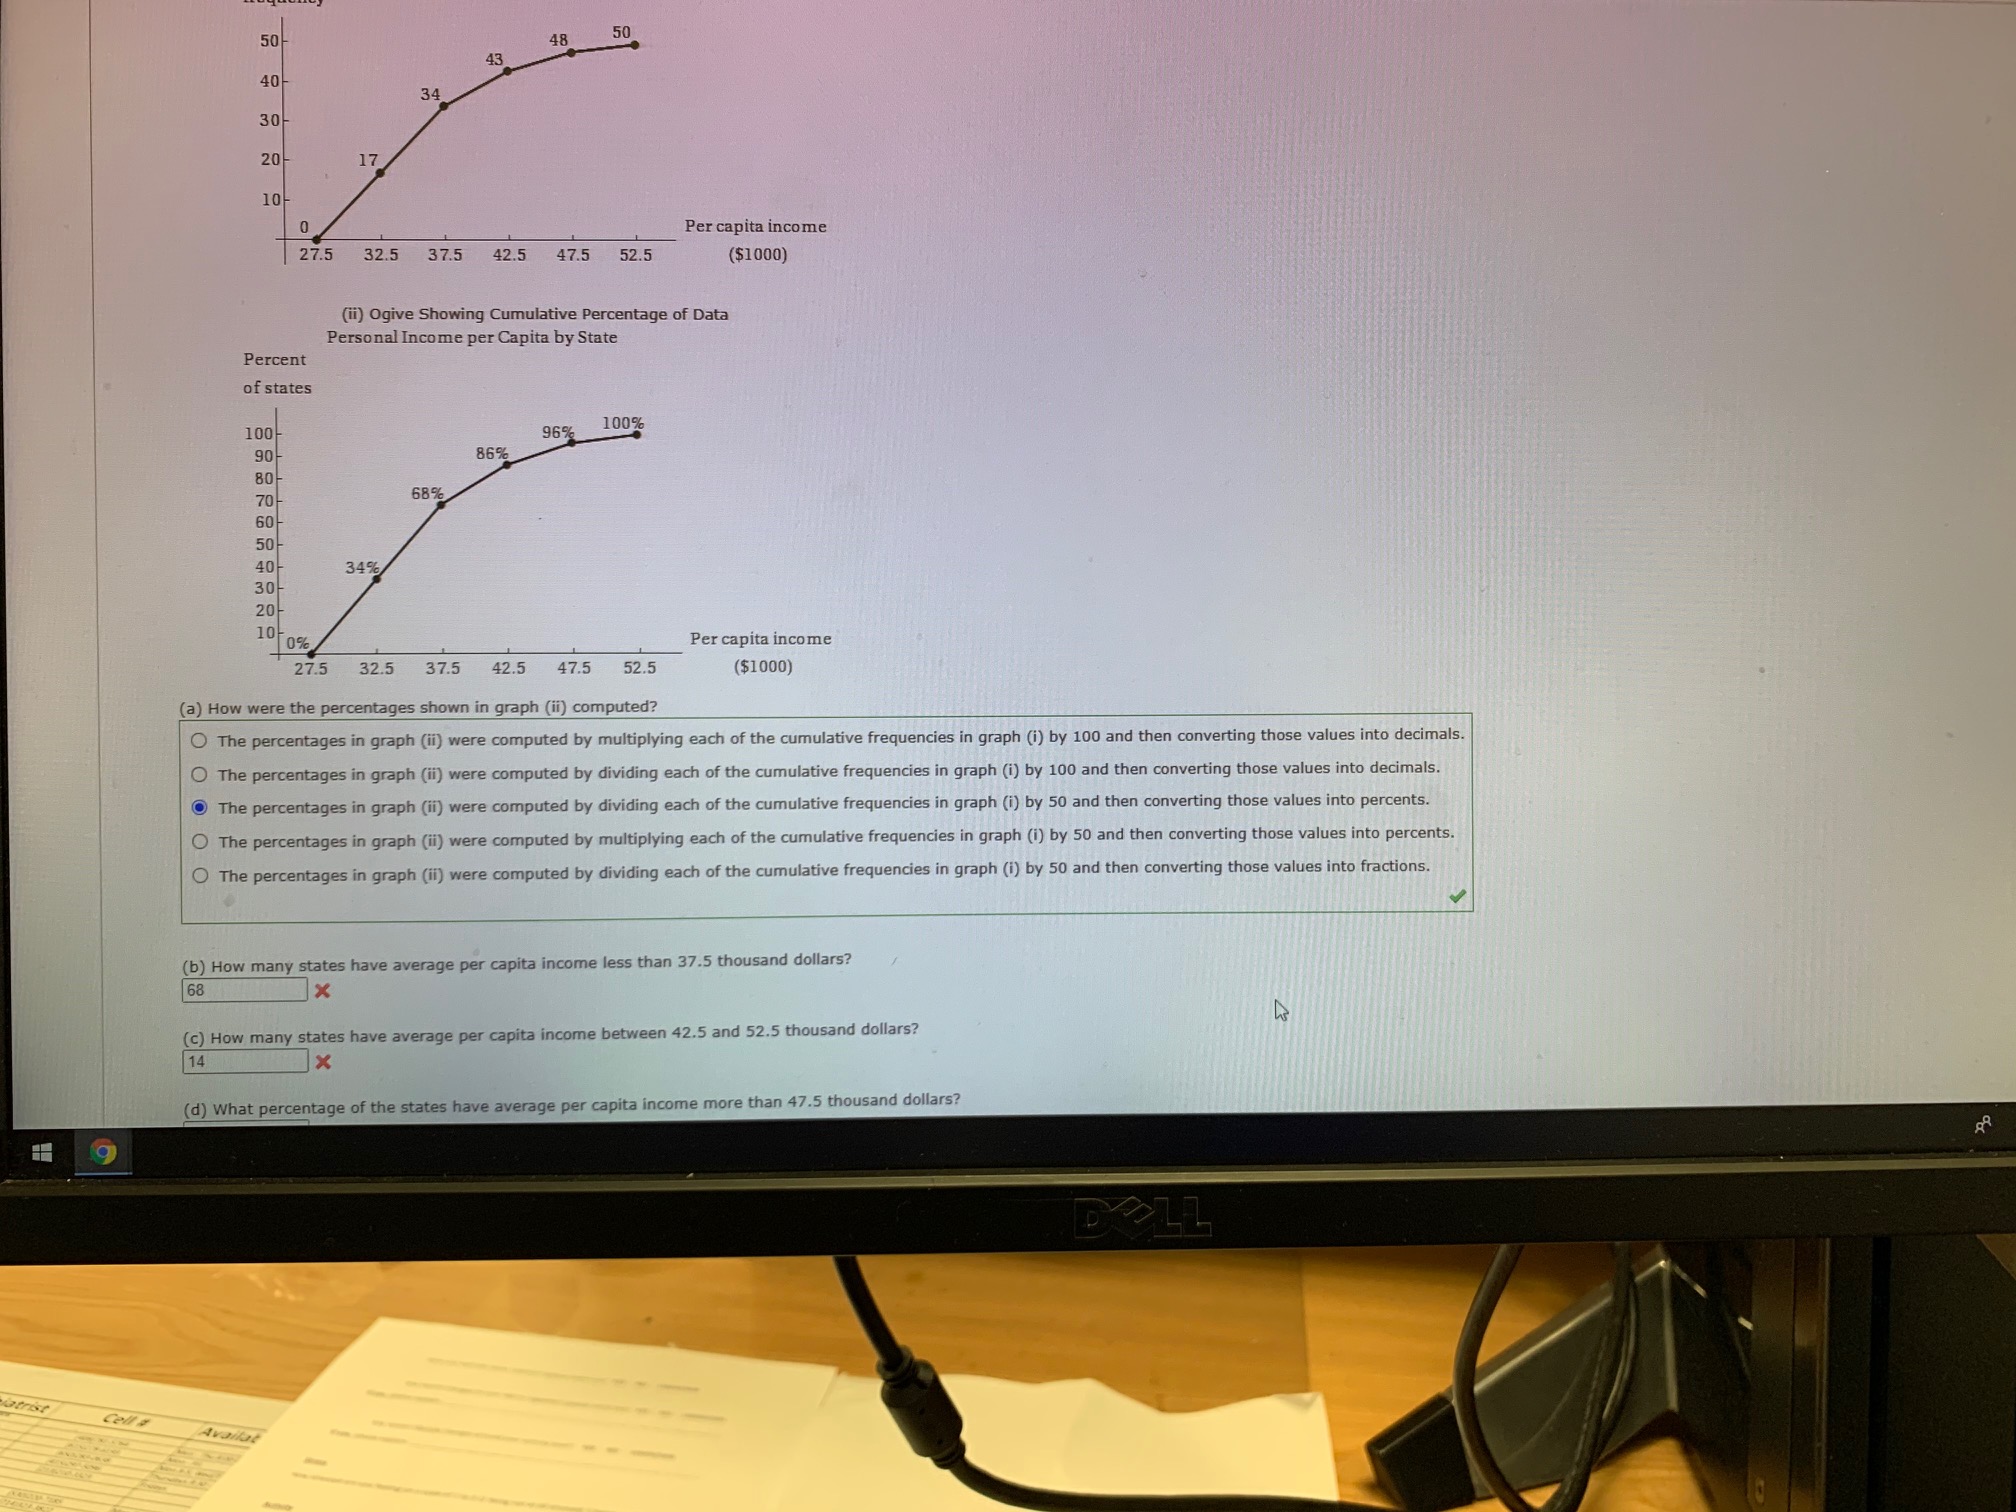
15. [3.4/3.57 Points] DETAILS PREVIOUS ANSWERS BBUNDERSTAT12 2.3.002.MI. MY NOTES ASK YOUR TEACHER Wetlands offer a diversity of benefits. They provide a habitat for wildlife, spawning grounds for U.S. commercial fish, and renewable timber resources. In the last 200 years, the United States has lost more than half its wetlands. Environmental Almanac gives the percentage of wetlands lost in each state in the last 200 years. For the 30 of the lower 48 states, the percentage loss of wetlands per state is as follows. 33 35 38 87 45 48 9 37 27 27 71 55 90 45 51 38 50 45 51 42 59 68 59 35 60 20 83 30 89 50 Make a stem-and-leaf display of these data. (Use the tens digit as the stem and the ones digit as the leaf. Enter NONE in any unused answer blanks.) Percent of Wetlands Lost 9 NONE 07 7 035578 8 25558 0 01 1599 0 8 379 How are the percentages distributed? Is the distribution skewed? Are there any gaps? (Select all that apply.) There is a gap showing that none of the lower 48 states has lost from 60% to 69% of its wetlands. The percentages are concentrated from 20% to 60%. These data are fairly symmetric, perhaps slightly skewed right. O There are no gaps in the data. There is a gap showing that none of the lower 48 states has lost from 10% to 19% of its wetlands. The percentages are concentrated from 60% to 90%. These data are strongly skewed left. 9:01 AM 9 8/19/2020 DOLL xchitrist Cell # Avail/submit?dep=2 4724&tags=autosave#question4570824_14 45 46 51 46 40 48 22 25 41 45 38 49 For this problem, use five classes. (a) Find the class width. 11 (b) Make a frequency table showing class limits, class boundaries, midpoints, frequencies, relative frequencies, and cumulative frequencies. (Round your relative frequencies to two decimal places.) Class Limits Class Boundaries Midpoint Frequency Relative Cumulative Frequency Frequency 32 21.5 32.5 32.5 8.00 43 27 43.5 42.00 X |25 54.5 1x |44.00 x 47 65.5 4.00 49 -76 65.5 76.5 2.00 * 50 (c) Draw a histogram. Percent Males Enrolled in Percent Males Enrolled in Coed Universities and Colleges Coed Universities and Colleges 30 Frequency 0.2 Frequency 0.1 5 22 33 44 55 66 76 33 44 55 66 76 Percent O Percent Percent Males Enrolled in Percent Males Enrolled in Coed Universities and Colleges Coed Universities and Colleges 0.7 0.6 Frequency Frequency DOLL trist Cella Availat50 48 50 43 40- 34 30- 20 17 10 0 Per capita income 27.5 32.5 37.5 42.5 47.5 52. ($1000) (ii) Ogive Showing Cumulative Percentage of Data Personal Income per Capita by State Percent of states 100 100% 90 86% 96% 80- 70- 68% 60- 50! 40- 34% 30- 20- 10 0% 27.5 Per capita income 32.5 37.5 42.5 47.5 52.5 ($1000) (a) How were the percentages shown in graph (ii) computed? The percentages in graph (ii) were computed by multiplying each of the cumulative frequencies in graph (i) by 100 and then converting those values into decimals. O The percentages in graph (ii) were computed by dividing each of the cumulative frequencies in graph (i) by 100 and then converting those values into decimals. The percentages in graph (ii) were computed by dividing each of the cumulative frequencies in graph (i) by 50 and then converting those values into percents. The percentages in 9 s in graph (ii) were computed by multiplying each of the cumulative frequencies in graph (i) by 50 and then converting those values into percents. The percentages in graph (ii) were computed by dividing each of the cumulative frequencies in graph (i) by 50 and then converting those values into fractions. (b) How many states have average per capita income less than 37.5 thousand dollars? 68 X c) How many states have average per capita income between 42.5 and 52.5 thousand dollars? 14 X d) What percentage of the states have average per capita income more than 47.5 thousand dollars? DOLL Cell s AvailatFor this assignment, you submit answers by question parts. The number of submissions remaining for each question part only chang Assignment Scoring Your last submission is used for your score. 1. [0/0.27 Points] DETAILS PREVIOUS ANSWERS BBUNDERSTAT12 2.1.001. What is the difference between a class boundary and a class limit? (Select all that apply.) Class boundaries specify the span of data values that fall within a class. Class limits specify the span of data values that fall within a class. Class limits are possible data values. O Class boundaries are possible data values. Class limits are not possible data values. O Class boundaries are not possible data values. Class boundaries are values halfway between the upper class limit of one class and the lower class limit of the next. Class limits are values halfway between the upper class boundary of one class and the lower class boundary of the next. Need Help? Read It Watch It 2. [0.27/0.27 Points] DETAILS PREVIOUS ANSWERS BBUNDERSTAT12 2.1.005.MI.SA. This question has several parts that must be completed sequentially. If you skip a part of the question, you will not receive any points fo Tutorial ExerciseThe book The Wall Street Journal. Guide to Information Graphics by Dona M. Wong gives strategies for using graphs and charts to display information effectively. One popular graph discussed is the donut pie chart. The donut pie chart is simply a pie chart with the center removed. A recent Harris Poll asked adults about their opinions regarding whether books should be banned from libraries because of social, language, violent, sexual, or religious content. The responses by education level to the question "Do you think that there are any books which should be banned completely?" are shown in the following donut pie charts. (1) (ii) Graphs made by Ramon Graph made by Keith (a) High school or less (b) College graduate Some college O Yes No Not at all sure Yes No Not at all sure (a) What feature of Keith's graph makes it difficult to visually compare the responses of those with some college to those shown in the other graphs? (Select all that apply.) O The graphs do not have data labels showing the percentages. O The graphs made by Keith and Ramon are all donut pie charts. The graphs made by Keith and Ramon compare groups across education level. The graphs made by Keith and Ramon use the same colors for each of the corresponding responses. The donut hole in the graph made by Keith is a different size than in the graphs made by Ramon. X How would you change Keith's graph for easier comparison? (Select all that apply.) O Combine the graphs into one donut pie chart. Make all donuts exactly th ame size, with the radius of the holes the same as well. Change the graphs from donut pie charts to time series graphs. Add data labels showing the percentages. O Use different sets of colors in each of the donut pie charts. b) Compare graphs made by Ramon. At which of the two education levels is the "no" response more frequent? High school or less Some college College graduate 11:50 AM 8 ~ X 8/19/2020 DOLL Psych iatrist Ted. Pharmacy 650-3+9-1373 Adam Jarczewski, MD NPI -5. [0/0.33 Points] DETAILS PREVIOUS ANSWERS BBUNDERSTAT12 2.3.005.MI.SA. MY NOTES ASK YOUR TEACHER This question has several parts that must be completed sequentially. If you skip a part of the question, you will not receive any points for the skipped part, and you will not be able to come back to the skipped part. Tutorial Exercise An annual marathon covers a route that has a distance of approximately 26 miles. Winning times for this marathon are all over 2 hours. The following data are the minutes over 2 hours for the winning male runners over two periods of 20 years each. Earlier Period 21 12 24 24 18 14 8 14 20 16 16 19 16 6 10 17 15 10 13 18 Recent Period 8 9 9 12 13 12 7 8 8 9 9 8 9 7 13 7 10 8 (a) Make a stem-and-leaf display for the minutes over 2 hours of the winning times for the earlier period. Use two lines per stem. (b) Make a stem-and-leaf display for the minutes over 2 hours of the winning times for the recent period. Use two lines per stem. (c) Compare the two distributions. How many times under 15 minutes are in each distribution? Step 1 (a) Make a stem-and-leaf display for the minutes over 2 hours of the winning times for the earlier period. Use two lines per stem. First, review the data for the earlier period. Earlier Period 21 12 24 24 18 14 8 14 20 16 16 19 16 6 10 17 15 10 13 18 Recall that a stem-and-leaf display is a method of exploratory data analysis that is used to rank-order and arrange data into groups. The digits of each data value will be divided into two parts. The leftmost part is called the stem and the rightmost part is called the leaf. The largest number in this data set is a two-digit number, so we need to first write all the numbers in the data set as two-digit numbers by adding leading zeros as needed. Earlier Period 21 12 24 24 18 14 08 14 20 16 16 19 16 06 10 17 15 10 13 18 Since all the numbers for the data are now two-digit numbers, the stem will be the number in the tens 9 DOLL5. [0/0.33 Points] DETAILS PREVIOUS ANSWERS BBUNDERSTAT12 2.3.005.MI.SA. MY NOTES ASK YOUR TEACHER This question has several parts that must be completed sequentially. If you skip a part of the question, you will not receive any points for the skipped part, and you will not be able to come back to the skipped part. Tutorial Exercise An annual marathon covers a route that has a distance of approximately 26 miles. Winning times for this marathon are all over 2 hours. The following data are the minutes over 2 hours for the winning male runners over two periods of 20 years each. Earlier Period 21 12 24 24 18 14 8 14 20 16 16 19 16 6 10 17 15 10 13 18 Recent Period 8 9 9 12 13 12 9 9 7 13 9 8 8 9 8 7 10 (a) Make a stem-and-leaf display for the minutes over 2 hours of the winning times for the earlier period. Use two lines per stem. (b) Make a stem-and-leaf display for the minutes over 2 hours of the winning times for the recent period. Use two lines per stem. (c) Compare the two distributions. How many times under 15 minutes are in each distribution? Step 1 (a) Make a stem-and-leaf display for the minutes over 2 hours of the winning times for the earlier period. Use two lines per stem. First, review the data for the earlier period. Earlier Period 21 12 24 24 18 14 8 14 20 16 16 19 16 6 10 17 15 10 13 18 Recall that a stem-and-leaf display is a method of exploratory data analysis that is used to rank-order and arrange data into groups. The digits of each data value will be divided into two parts. The leftmost part is called the stem and the rightmost part is called the leaf. The largest number in this data set is a two-digit number, so we need to first write all the numbers in the data set as two-digit numbers by adding leading zeros as needed. Earlier Period 21 12 24 24 18 14 08 14 20 16 16 19 16 06 10 17 15 10 13 18 Since all the numbers for the data are now two-digit numbers, the stem will be the number in the tens 9 DOLL hiatrist Cell & Availabilit-> C " webassign.net/web/Student/Assignment-Responses/last?dep=24474723?token=0C2D53AE4EB5854EOD3CED9C384BE04AE42A10A849A614DD7D241876D407A772D7576D2347C2CB39EF6276E14EEA2BOAB00644850405C8695122822F083358BA2686EEE64. (a) Make a stem-and-leaf display for the minutes over 2 hours of the winning times for the earlier period. Use two lines per stem. First, review the data for the earlier period. Earlier Period 21 12 24 24 18 14 8 14 20 16 16 19 16 6 10 17 15 10 13 18 Recall that a stem-and-leaf display is a method of exploratory data analysis that is used to rank-order and arrange data into groups. The digits of each data value will be divided into two parts. The leftmost part is called the stem and the rightmost part is called the leaf. The largest number in this data set is a two-digit number, so we need to first write all the numbers in the data set as two-digit numbers by adding leading zeros as needed. Earlier Period 21 12 24 24 18 14 08 14 20 16 16 19 16 06 10 17 15 10 13 18 Since all the numbers for the data are now two-digit numbers, the stem will be the number in the tens tens place and the leaf will be the number in the Jones ones place. Now, organize the numbers in the data set from the smallest to the largest value. Earlier Period 06, 08, 10, 10, 12, 13, 14, 14, 15, 16 9 16 , 16, 16, 17, 18, 18, 19 4 2 19 , 20, 21, 24, 24 Step 2 We now have an ordered data set. Earlier Period 06, 08, 10, 10, 12, 13, 14, 14, 15, 16, 16, 16, 17, 18, 18, 19, 20, 21, 24, 24 Make a stem-and-leaf display for the ordered data set using two lines per stem. Recall that when you use two lines per stem, place leaves 0 to 4 on the first stem line and leaves 5 to 9 on the next stem line. Minutes Beyond 2 Hours Earlier Period 6 8 8 1 0 1 002344 1 5 6 6 6 67889 2 014 4 7 24 9 DOLLCredible Clozapine REMS - Sign in x | M (no subject) - dgaytan89@gmail MATH205 - Section 2.3 Ho VA MATH205 - Section 2.3 Homewor X C webassign.net/web/Student/Assignment-Responses/last?dep=24474723?token=0C2D53AE4EB5854EOD3CED9C384BE04AE42A10A849A614DD7D241A876D407A772DZE76D2347C2CB3E9EF627614EEA2BOABO0644850405C8695122822F083358BA268 24, 24 Step 2 We now have an ordered data set. Earlier Period 06, 08, 10, 10, 12, 13, 14, 14, 15, 16, 16, 16, 17, 18, 18, 19, 20, 21, 24, 24 Make a stem-and-leaf display for the ordered data set using two lines per stem. Recall that when you use two lines per stem, place leaves 0 to 4 on the first stem line and leaves 5 to 9 on the next stem line. Minutes Beyond 2 Hours Earlier Period 6 8 0 58 1 0 91 0 0234 4 5 6 6 0 6 67889 N 0 14 4 0 1 4 Step 3 Complete the full stem-and-leaf display. Enter NONE in any unused answer blank. Minutes Beyond 2 Hours Earlier Period Submit|Skip (you cannot come back) Need Help? Read it Watch it 6. [0.33/0.33 Points] DETAILS PREVIOUS ANSWERS BBUNDERSTAT12 2.3.006. MY N DOLLponses/last?dep=24474723?token=OC 849A614DD7D241A876D407A772D7E76D2347C2CB39EF627614EEA2BOAB0064485040508695122822F083358BA2686EEE64... 3. [0.09/0.33 Points] DETAILS PREVIOUS ANSWERS BBUNDERSTAT12 2.3.002.MI.SA. MY NOTES ASK YOUR TEACHER PRACTICE ANOTHER This question has several parts that must be completed sequentially. If you skip a part of the question, you will not receive any points for the skipped part, and you will not be able to come back to the skipped part. Tutorial Exercise Wetlands offer a diversity of benefits. They provide a habitat for wildlife, spawning grounds for U.S. commercial fish, and renewable timber resources. In the last 200 years, the United States has lost more than half its wetlands. Environmental Almanac gives the percentage of wetlands lost in each state in the last 200 years. For 30 of the lower 48 states, the percentage loss of wetlands per state is as follows. 46 67 24 35 74 39 60 87 35 36 46 50 38 27 28 46 49 38 56 : 35 56 52 50 81 48 89 54 Make a stem-and-leaf display of these data. How are the percentages distributed? Is the distribution skewed? Are there any gaps? Step 1 We are given the following data set and we are to make a stem-and-leaf display of this data. 46 67 24 35 74 39 60 87 35 9 36 46 50 38 27 28 46 49 38 91 56 50 35 5 52 50 81 48 89 54 Recall that a stem-and-leaf display is a method of exploratory data analysis that is used to rank-order and arrange data into groups. The digits of each data value will be divided into two parts. The leftmost part is called the stem and the rightmost part is called the leaf. The largest number in this data set is a two-digit number, so we need to first write all the numbers in the data set as two-digit numbers by adding leading zeros as needed. 46 67 24 35 74 39 0 87 35 09 36 46 50 38 27 28 46 49 38 91 56 50 35 56 52 50 81 48 89 54 Since all the numbers for the data are now two-digit numbers, the stem will be the number in the tens tens place and the leaf will be the number in the Jones ones place. Now, organize the numbers in the data set from smallest to largest value. 09 24 27 28 35 35 35 36 36 38 38 39 46 46 46 48 49 50 50 11:52 AM 9 8/19/2020 DELL X chiatrist Cell Availabili Teds PharmacyC webassign.net/web/Student/Assignment-Responses/last?dep=24474723?token=0C2D53AE4EB5854EOD3CED9C384BE04AE42A10A8494614DD7D241876D407A772DZE76D2347C2CB39EF627614EEA2BOABO064485040508695122822F083358BA2686EEE64... # # D : 46 67 24 35 74 39 60 87 35 09 36 46 50 38 27 28 46 49 38 91 56 50 35 56 52 50 81 48 89 54 Since all the numbers for the data are now two-digit numbers, the stem will be the number in the tens tens place and the leaf will be the number in the jones s ones place. Now, organize the numbers in the data set from smallest to largest value. 09 24 27 28 35 35 35 36 38 38 39 46 46 46 48 49 50 50 50 52 54 56 56 60 67 74 81 87 687 89 91 Step We now have an ordered data set. 09 24 27 28 35 35 35 36 38 38 39 46 46 46 48 49 50 50 50 52 54 56 56 60 67 74 81 87 89 91 Make a stem-and-leaf display for the ordered data set. Percent of Wetlands Lost 0 9 7 2 9 1 NONE 2 4 7 6 6 7 8 3 5 5 568 8 9 4 6 6 689 5 0 0 0 2 0 2 46 6 6 0 7 7 4 8 1 7 6 1 7 9 9 1 Step 3 Complete the full stem-and-leaf display. (Use the tens digit as the stem and the ones digit as the leaf. Enter NONE in any unused answer blanks.) Percent of Wetlands Lost 11:52 AM 8/19/2020 9 DELL crist Cell & Availabili* WA MATH205 - Section 2.3 Homewol * + C webassign.net/web/Student/Assignment-Responses/last?dep=24474723?token=0C2D53AE4EB5854EOD3CED9C384BE04AE42A10A849A614DD7D241876D407A772DZE76D2347C2CB39EF627614EEA2BOABO0644850405C8695122822F083358BA2686EEE64.. * * We now have an ordered data set. 09 24 27 28 35 35 35 36 38 38 39 46 46 46 48 49 50 50 50 52 54 56 56 60 67 74 81 87 89 91 Make a stem-and-leaf display for the ordered data set. Percent of Wetlands Lost 0 9 9 9 1 NONE 2 4 7 0 5 7 8 3 5 5 5 6 8 8 9 4 6 6 689 5 0 0 0 2 0 9 2 46 6 6 0 7 7 4 8 1 7 0 9 7 9 9 1 Step 3 Complete the full stem-and-leaf display. (Use the tens digit as the stem and the ones digit as the leaf. Enter NONE in any unused answer blanks.) Percent of Wetlands Lost 02234 556677788 01222233344 55555566668889 0 0 0112 5677888 0 1 XXXXXXX 0 02 8 8 NONE Submit Skip ( you cannot come back ) Need Help? Read It Watch It Viewing Saved Work Revert to Last Response 1x 11:53 AM * 8/19/2020 DELL Cella Availabilit
Step by Step Solution
There are 3 Steps involved in it

Get step-by-step solutions from verified subject matter experts