

Question: i need help Use the graph below for parts a to f. For numerical responses attach labels/units as appropriate. The Waiting Times in Minutes for

i need help
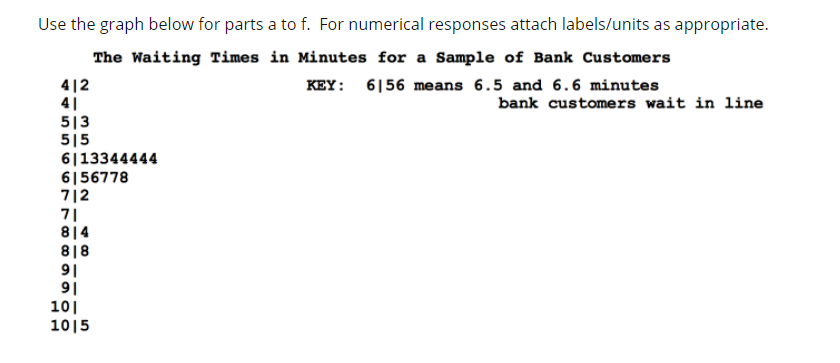
Use the graph below for parts a to f. For numerical responses attach labels/units as appropriate. The Waiting Times in Minutes for a Sample of Bank Customers 412 KEY : 656 means 6.5 and 6.6 minutes 41 bank customers wait in line 513 515 6/13344444 6156778 712 71 814 818 91 91 101 1015a. The graph is a (insert type of graph) b. The highest data value is c. There are rows of the plot with no data values. d. How many data values are represented on the fifth line of the plot? e. The mode for this data set is f. What is the sample size
Step by Step Solution
There are 3 Steps involved in it
1 Expert Approved Answer
Step: 1 Unlock

Question Has Been Solved by an Expert!
Get step-by-step solutions from verified subject matter experts
Step: 2 Unlock
Step: 3 Unlock