

Question: I need help with 22 hospitals used daily census figures ( the number of occupied beds) to plan staffing. Below are the daily census figures
I need help with 22
hospitals used daily census figures ( the number of occupied beds) to plan staffing. Below are the daily census figures for August, a randomly selected month in the fall.
a) identify the variable of interest along with the measurement scale
b) calculate the 5th percentile, the 50 percentile in the 95th percentile for this data set. Be sure to label each valley using the appropriate symbol
c) interpret the meaning of these values statistically and then use this interpretation to make a statement about the census of the hospital
d) construct a box plot and histogram side by side. Know how the shape of the distribution can you determine by either the box plot the histogram
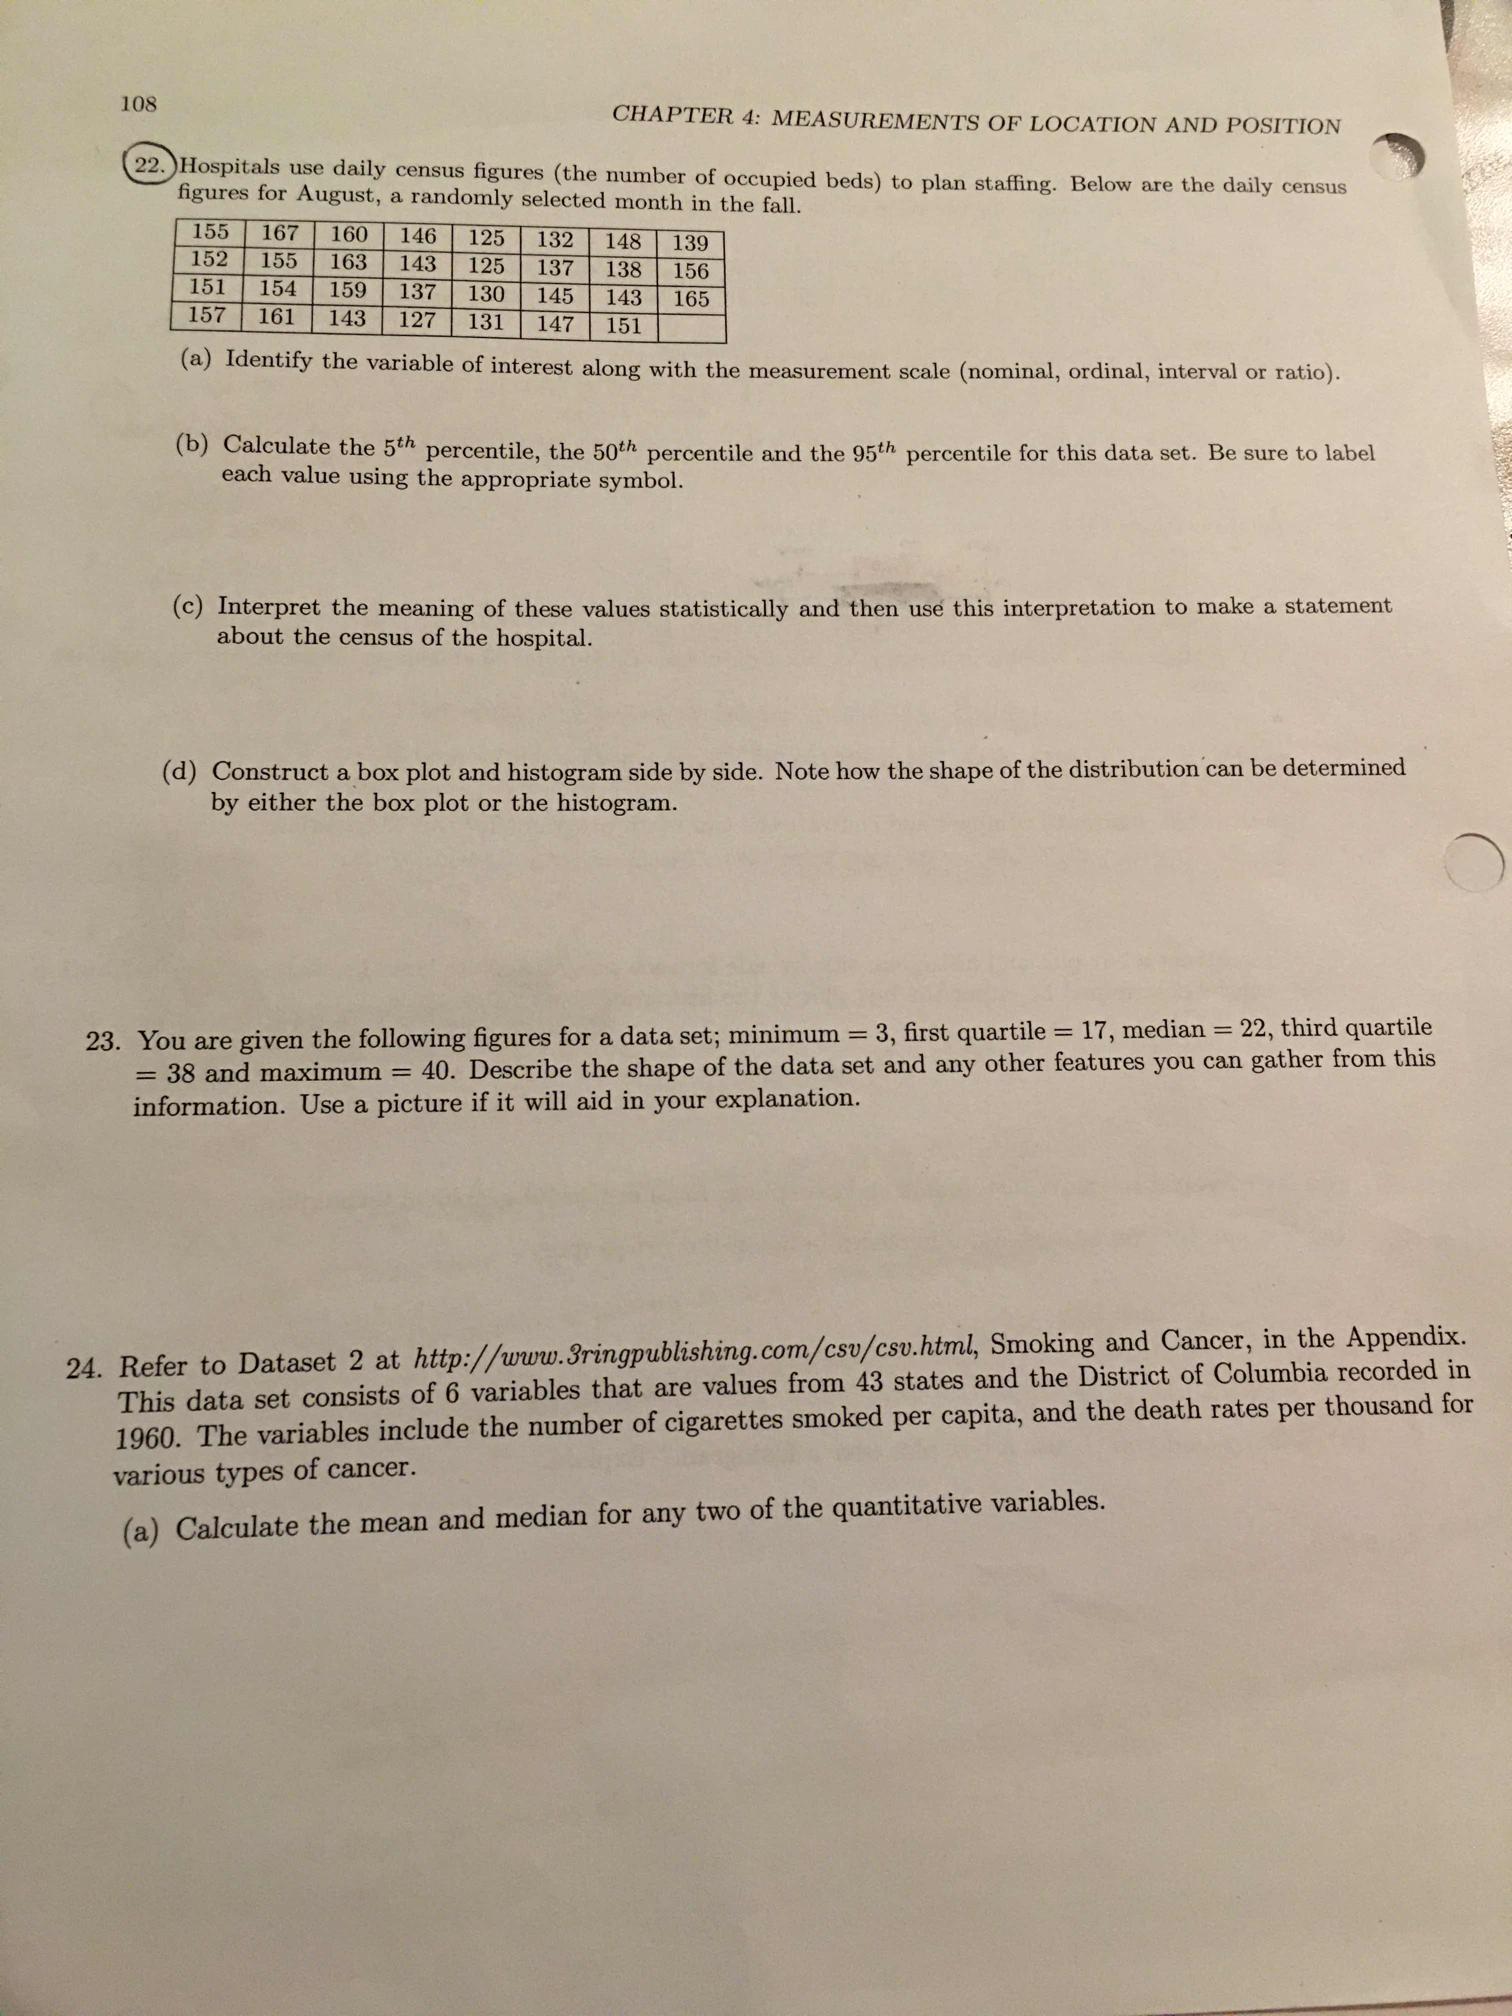
108 CHAPTER 4: MEASUREMENTS OF LOCATION AND POSITION 22. Hospitals use daily census figures (the number of occupied beds) to plan staffing. Below are the daily census figures for August, a randomly selected month in the fall. 155 167 160 146 125 132 148 139 152 155 163 143 125 137 138 156 151 154 159 137 130 145 143 157 161 143 127 131 147 151 165 (a) Identify the variable of interest along with the measurement scale (nominal, ordinal, interval or ratio). (b) Calculate the 5th percentile, the 50th percentile and the 95th percentile for this data set. Be sure to label each value using the appropriate symbol. (c) Interpret the meaning of these values statistically and then use this interpretation to make a statement about the census of the hospital. (d) Construct a box plot and histogram side by side. Note how the shape of the distribution can be determined by either the box plot or the histogram. 23. You are given the following figures for a data set; minimum = 3, first quartile = 17, median = 22, third quartile = 38 and maximum = 40. Describe the shape of the data set and any other features you can gather from this information. Use a picture if it will aid in your explanation. 24. Refer to Dataset 2 at http://www.3ringpublishing.com/csv/csu.html, Smoking and Cancer, in the Appendix. This data set consists of 6 variables that are values from 43 states and the District of Columbia recorded in 1960. The variables include the number of cigarettes smoked per capita, and the death rates per thousand for various types of cancer. (a) Calculate the mean and median for any two of the quantitative variables
Step by Step Solution
There are 3 Steps involved in it

Get step-by-step solutions from verified subject matter experts