

Question: I need help with #4 please 0+4-4, the third would be 4+4 - 8, and so one, until you have 5 intervals. Now the upper
I need help with #4 please
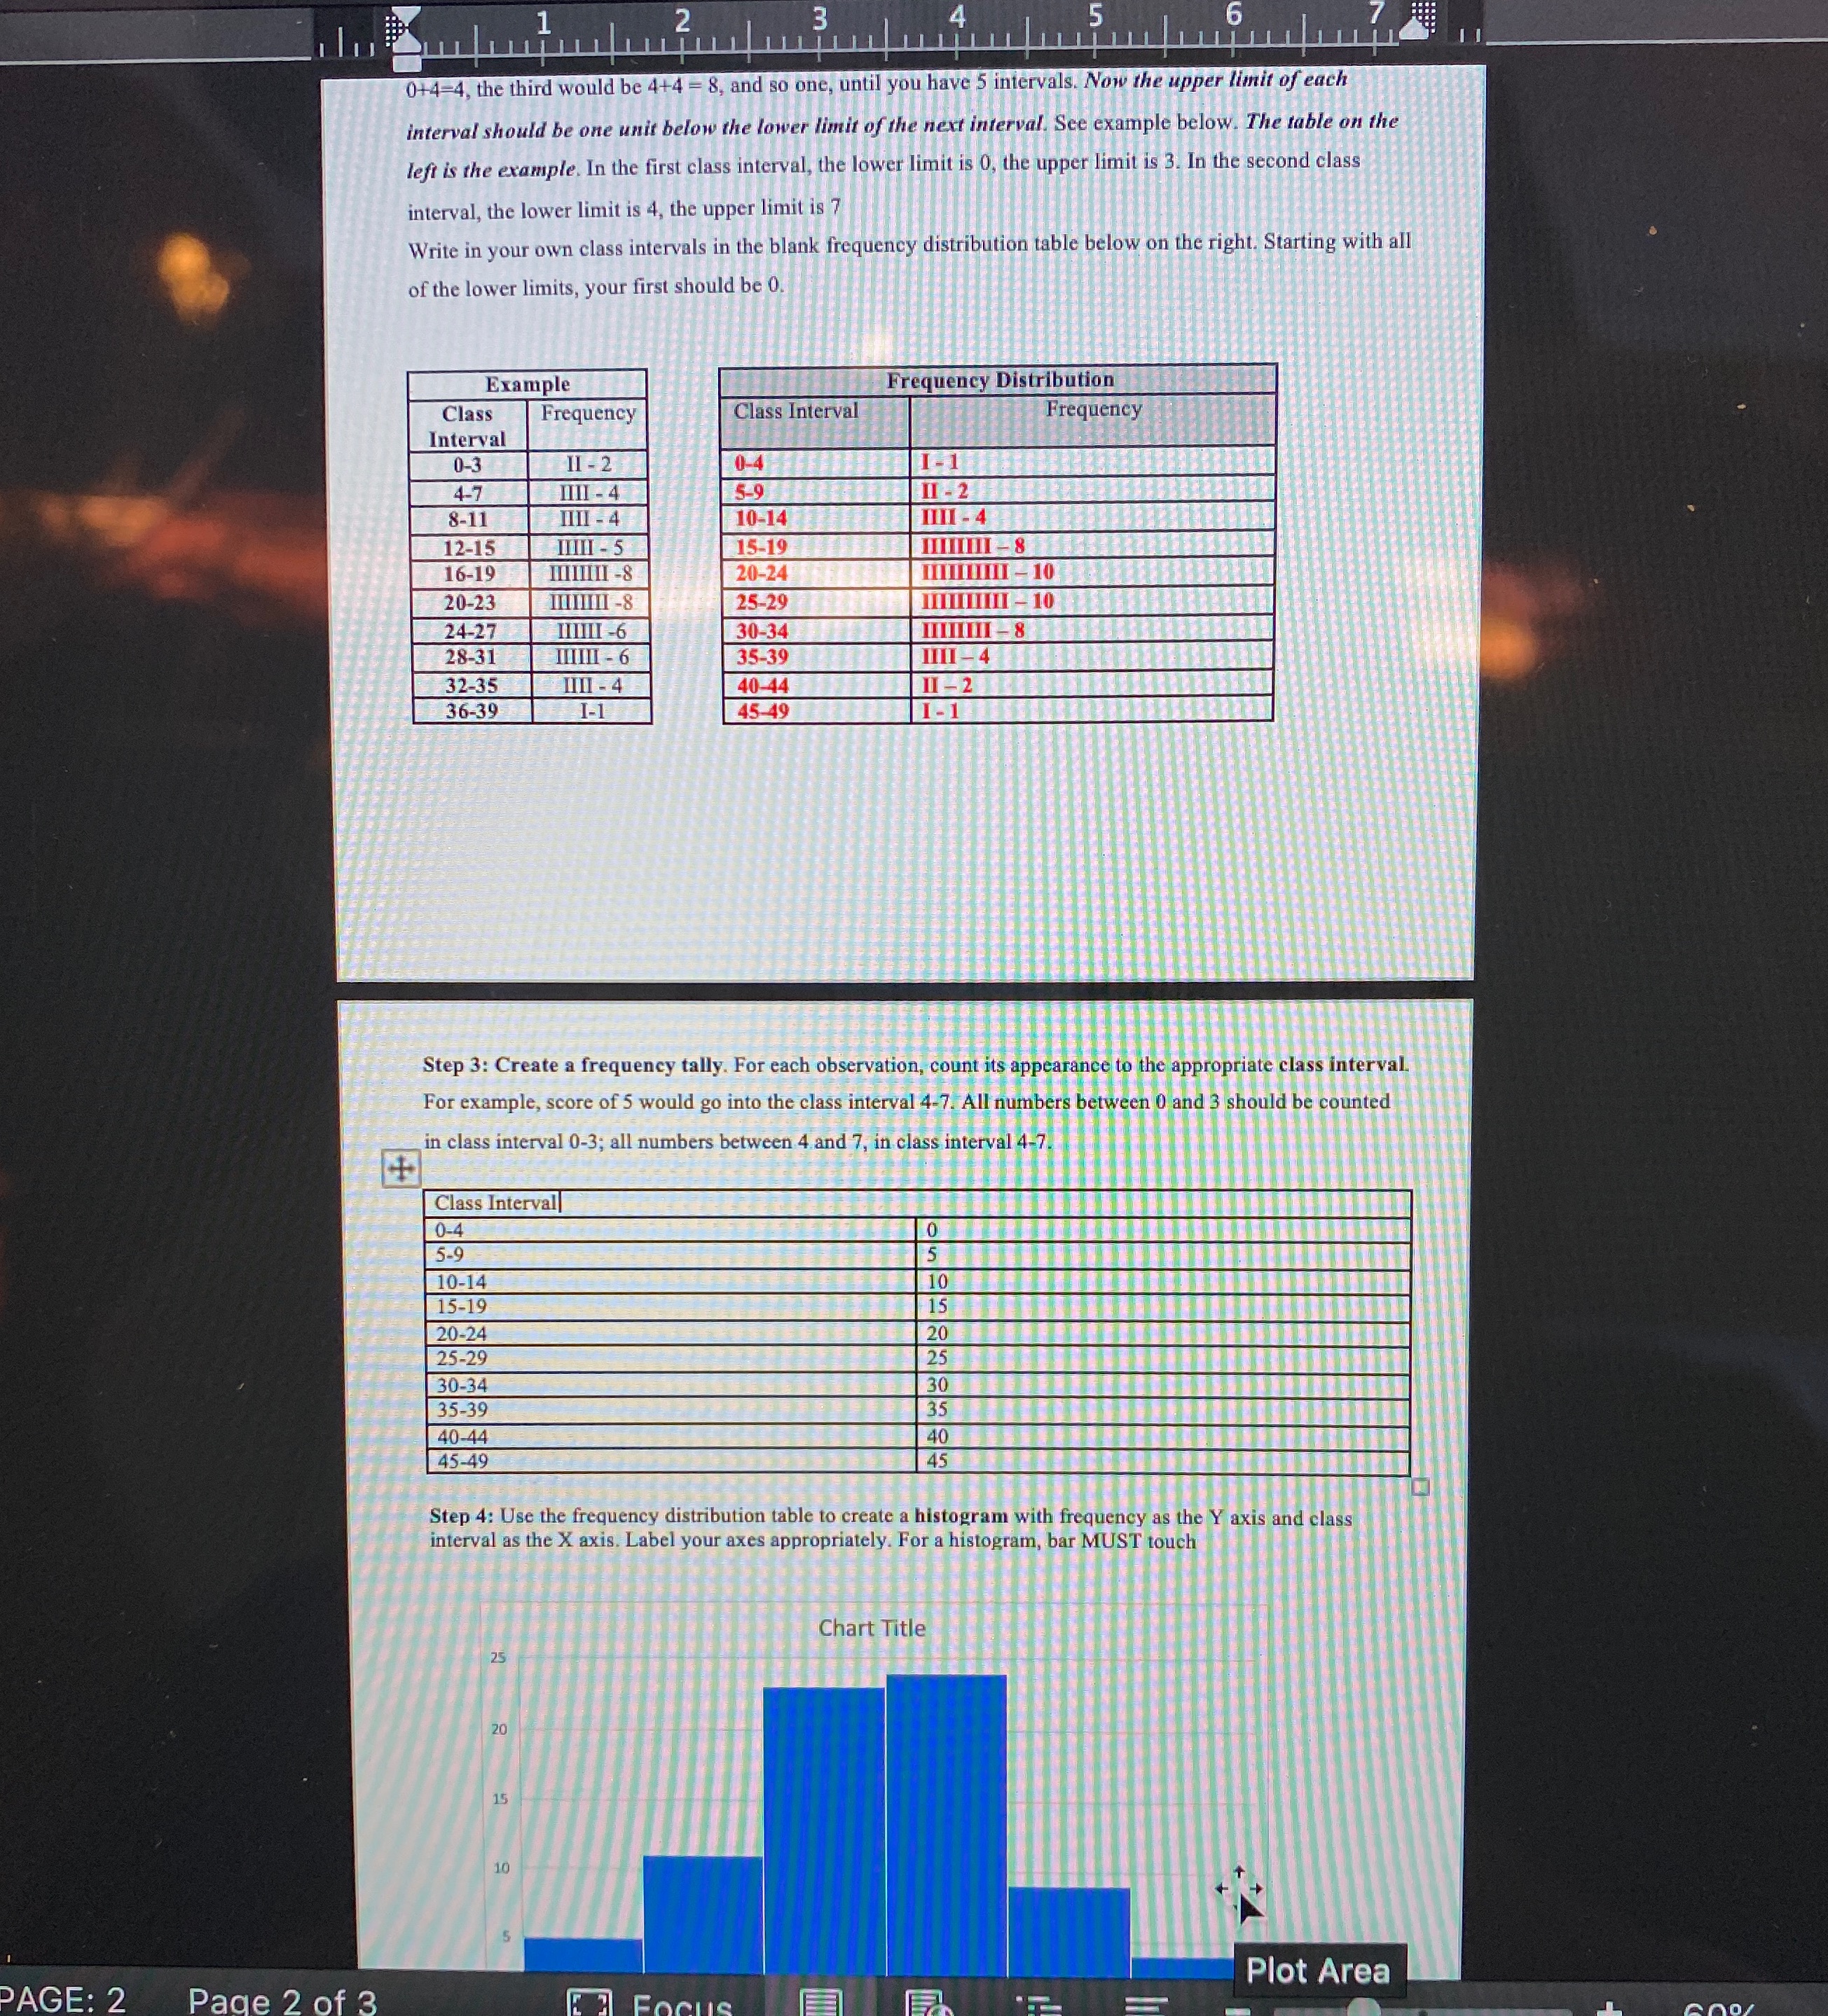
0+4-4, the third would be 4+4 - 8, and so one, until you have 5 intervals. Now the upper limit of each interval should be one unit below the lower limit of the next interval. See example below. The table on the left is the example. In the first class interval, the lower limit is 0, the upper limit is 3. In the second class interval, the lower limit is 4, the upper limit is 7 Write in your own class intervals in the blank frequency distribution table below on the right. Starting with all of the lower limits, your first should be 0. Example Class Frequency Distribution Frequency Interval Class Interval Frequency 0-3 11-2 4-7 0-4 I-1 IIII - 4 8-11 5-9 IIII - 4 HI - 2 12-15 10-14 IIIII - 5 IIII - 4 16-19 IIIIIIII -8 15-19 20-24 20-23 IIIIIIII -8 IIIIIIIII - 10 24-27 25-29 28-31 IIIIII -6 IIIIII - 30-34 32-35 35-39 IIII - 4 36-39 I-1 40-44 45-49 1I -2 I-1 Step 3: Create a frequency tally. For each observation, count its appearance to the appropriate class interval For example, score of 5 would go into the class interval 4-7. All numbers between 0 and 3 should be counted in class interval 0-3; all numbers between 4 and 7, in class interval 4-7. Class Intervall 0-4 5-9 10-14 15-19 10 20-24 15 25-29 20 30-34 25 35-39 30 40-44 35 45-49 40 Step 4: Use the frequency distribution table to create a histogram with frequency as the Y axis and class interval as the X axis. Label your axes appropriately. For a histogram, bar MUST touch Chart Title PAGE: 2 Page 2 of 3 Plot Area
Step by Step Solution
There are 3 Steps involved in it

Get step-by-step solutions from verified subject matter experts