

Question: I need help with a. b. c. Please, I will leave a upvote. Thank you. Problem 1: A linear empirical equation was proposed to model
I need help with a. b. c. Please, I will leave a upvote. Thank you.
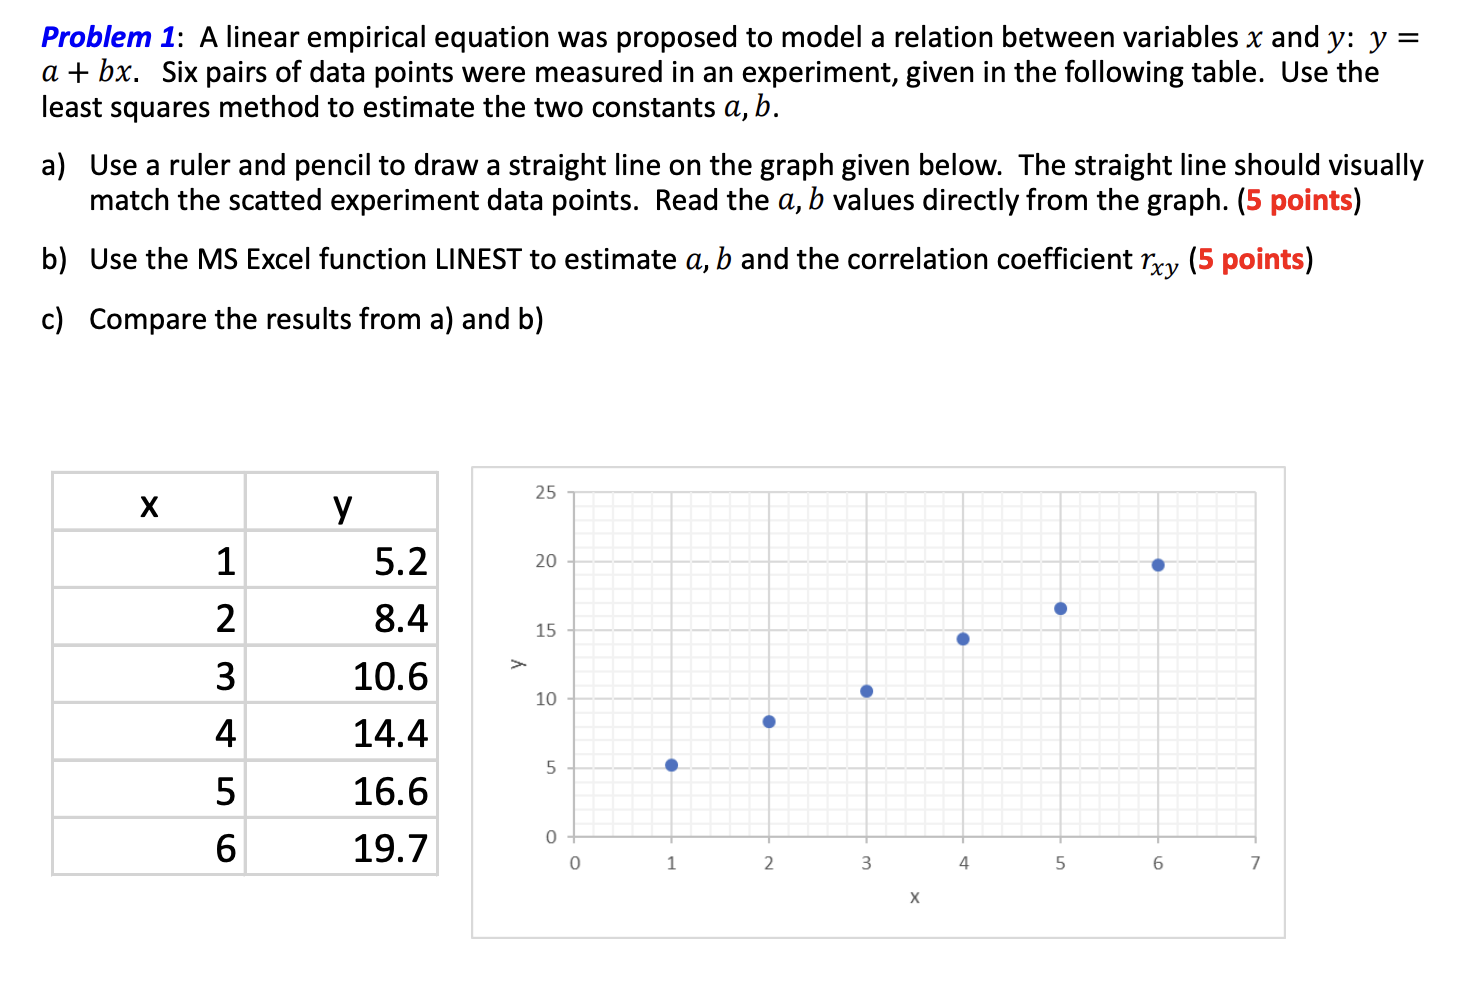
Problem 1: A linear empirical equation was proposed to model a relation between variables x and y : y= a+bx. Six pairs of data points were measured in an experiment, given in the following table. Use the least squares method to estimate the two constants a,b. a) Use a ruler and pencil to draw a straight line on the graph given below. The straight line should visually match the scatted experiment data points. Read the a,b values directly from the graph. (5 points) b) Use the MS Excel function LINEST to estimate a,b and the correlation coefficient rxy (5 points) c) Compare the results from a) and b)
Step by Step Solution
There are 3 Steps involved in it

Get step-by-step solutions from verified subject matter experts