

Question: I need help with A,B,C I tried this problem multiple times if I can have help please (a) Determine a point estimate for the population
I need help with A,B,C I tried this problem multiple times if I can have help please
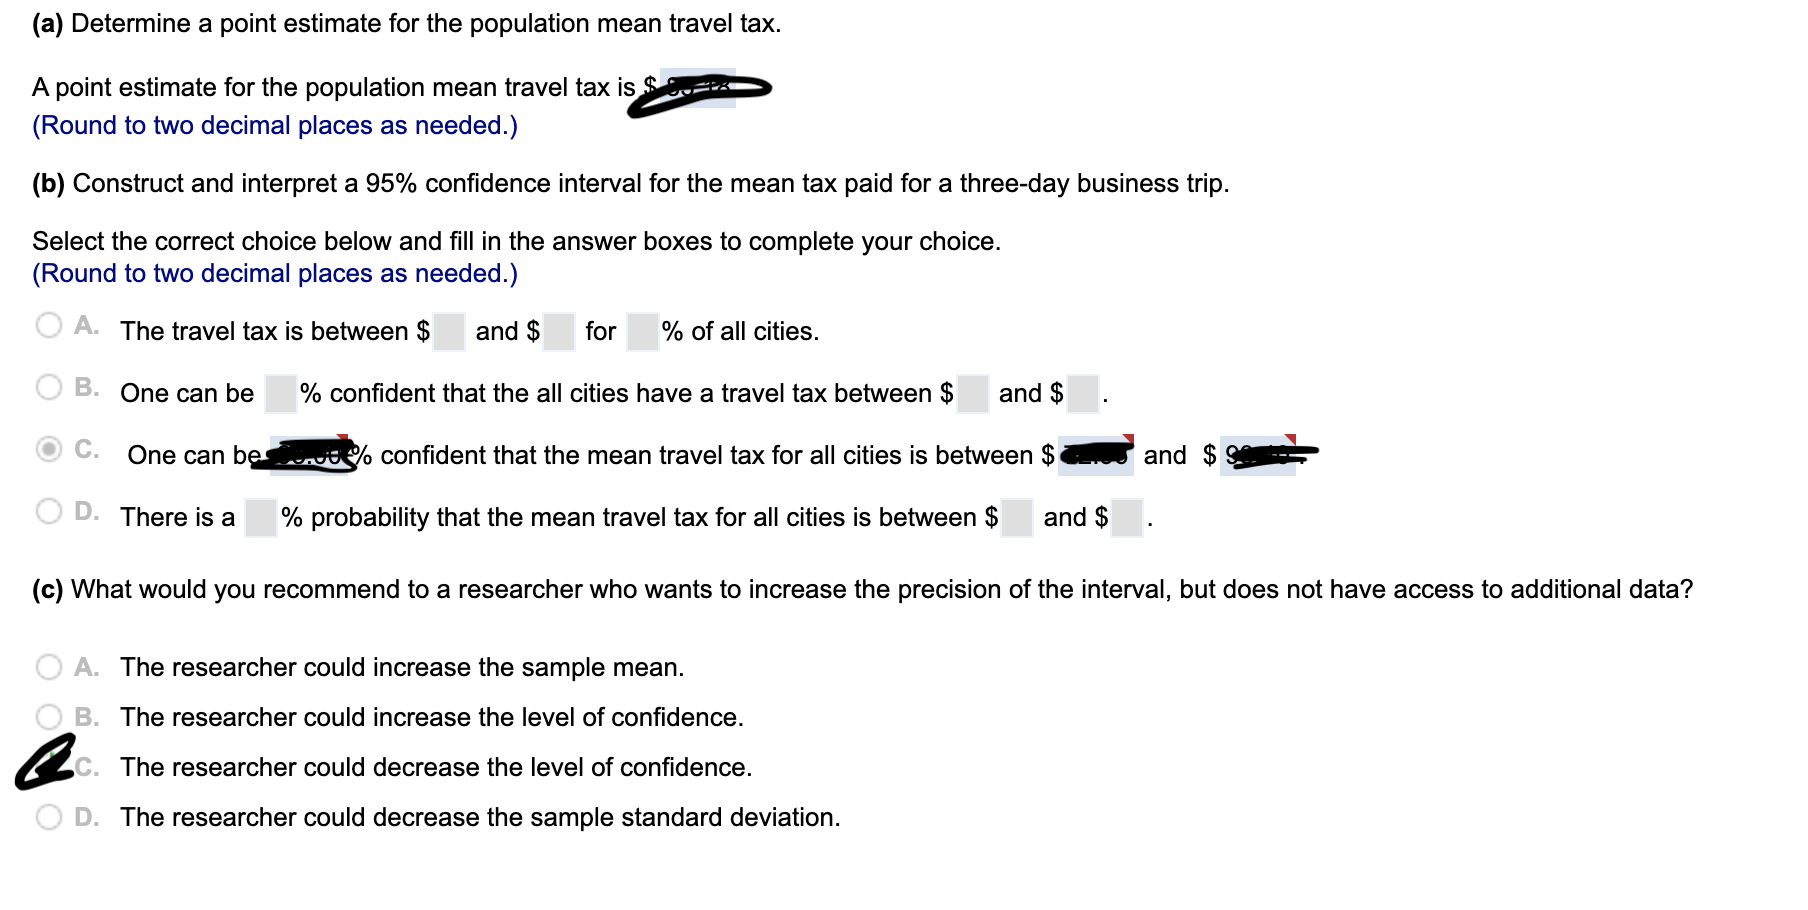
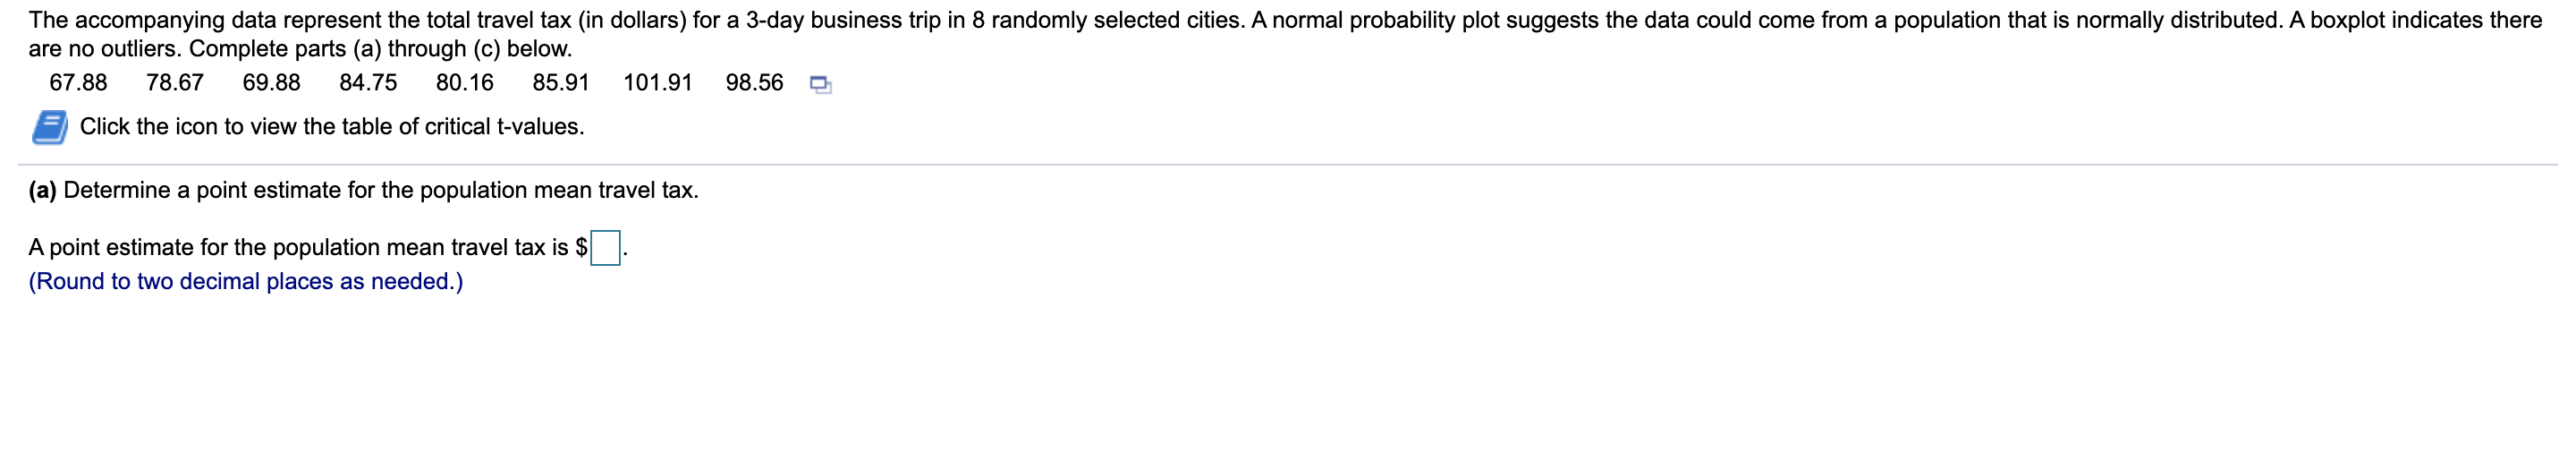
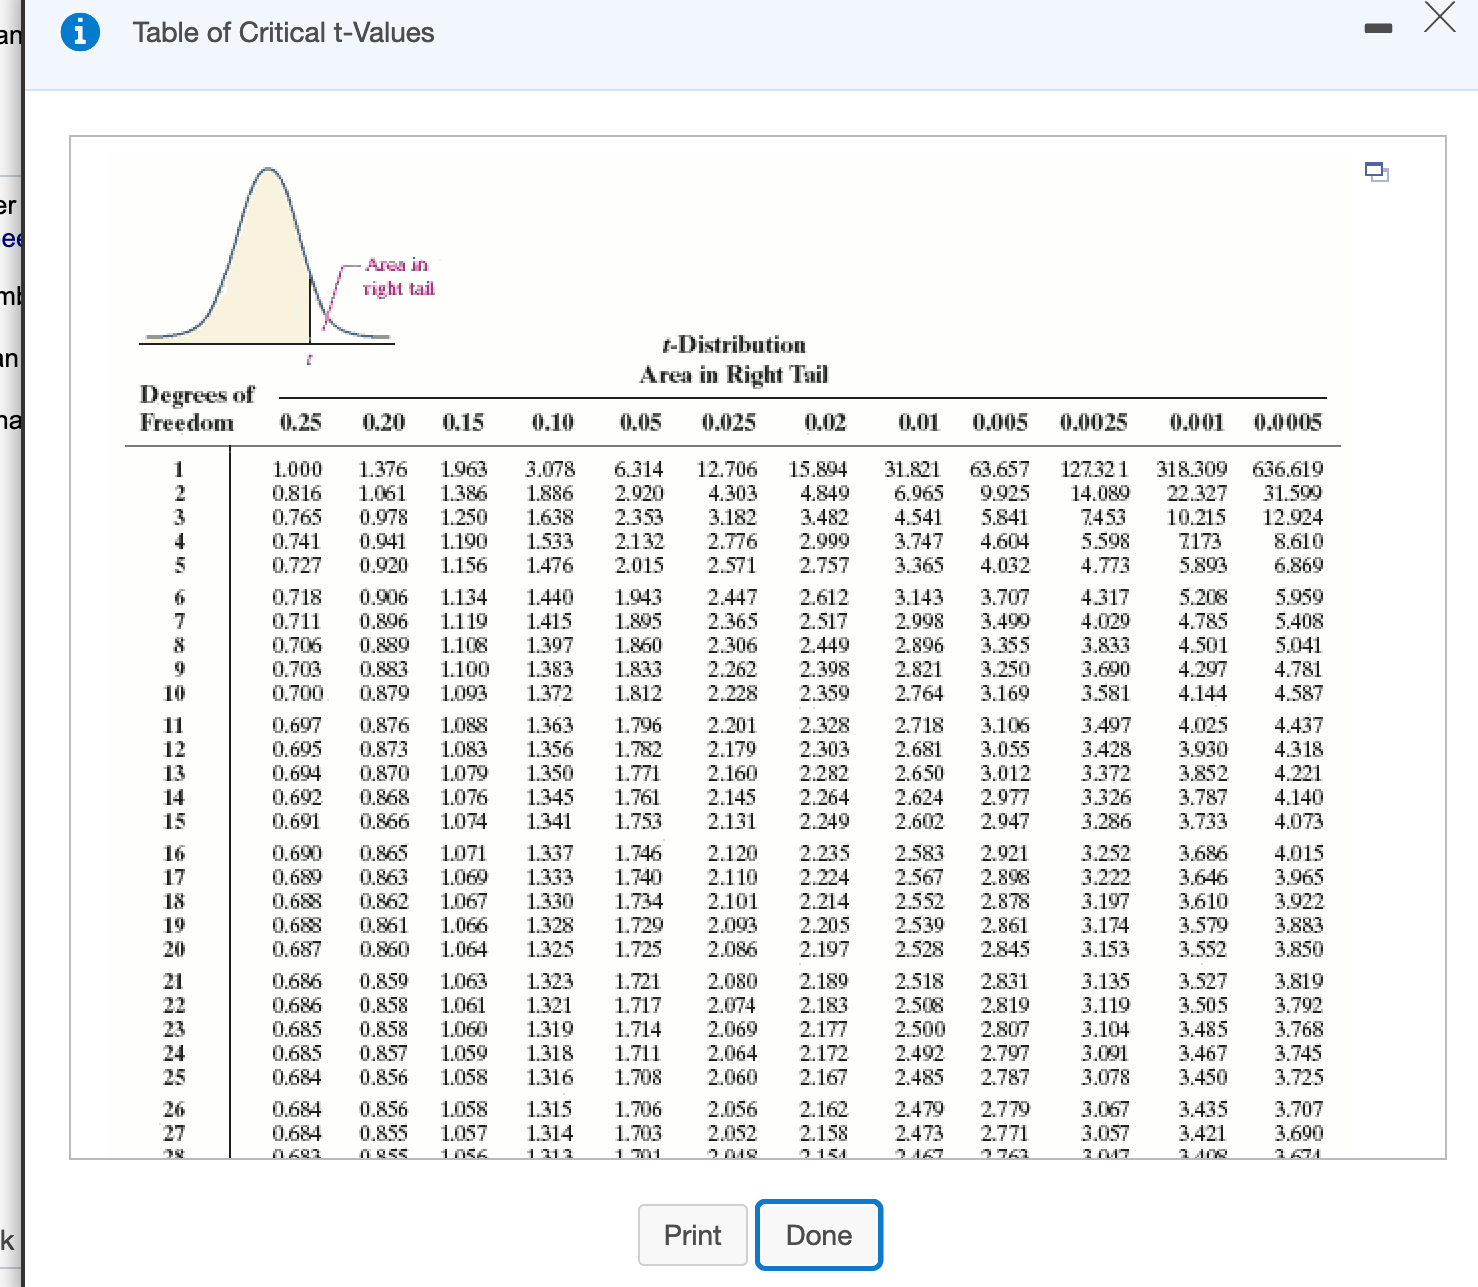
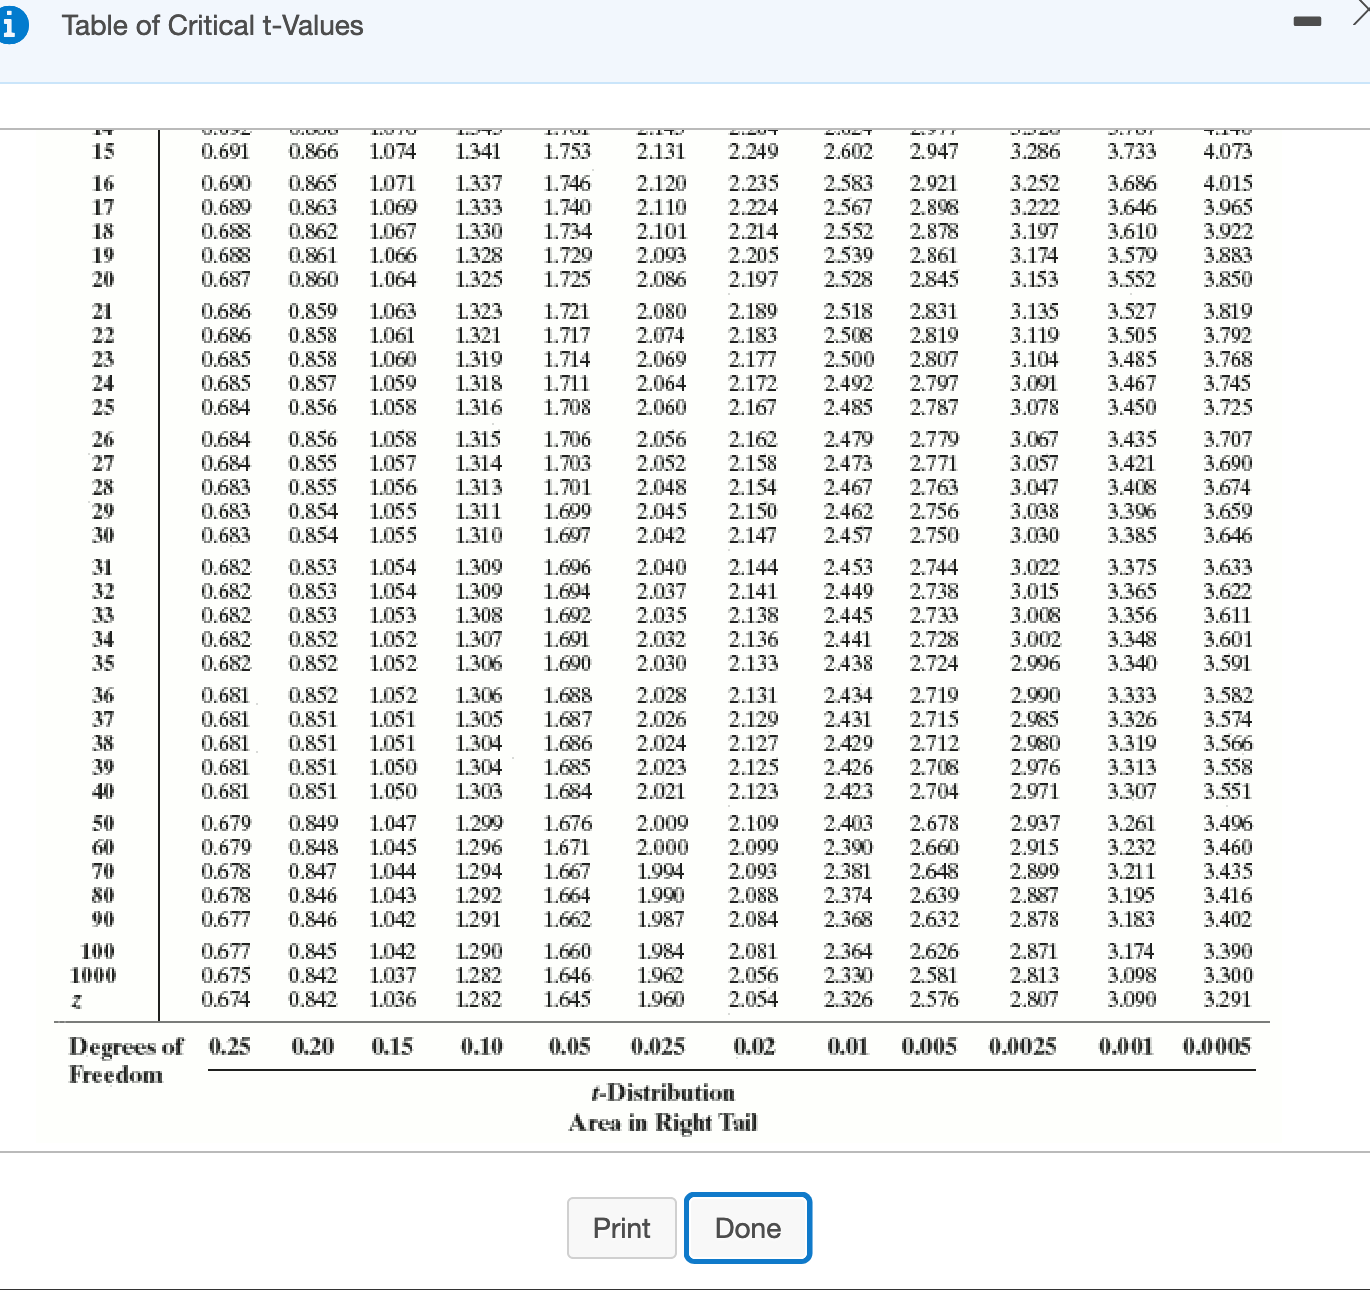
(a) Determine a point estimate for the population mean travel tax. A point estimate for the population mean travel tax is $ (Round to two decimal places as needed.) (b) Construct and interpret a 95% confidence interval for the mean tax paid for a three-day business trip. Select the correct choice below and fill in the answer boxes to complete your choice. (Round to two decimal places as needed.) O A. The travel tax is between $ and $ for % of all cities. O B. One can be % confident that the all cities have a travel tax between $ and $ O C. One can bestove . confident that the mean travel tax for all cities is between $ and $ 9- O D. There is a % probability that the mean travel tax for all cities is between $ and $ (c) What would you recommend to a researcher who wants to increase the precision of the interval, but does not have access to additional data? O A. The researcher could increase the sample mean. O B. The researcher could increase the level of confidence. The researcher could decrease the level of confidence. O D. The researcher could decrease the sample standard deviation.The accompanying data represent the total travel tax (in dollars) for a 3-day business trip in 6 randomly selected cities. A normal probability plot suggests the data could come from a population that is normally distributed. A boxplot indicates there are no outliers. Complete parts (a) through (0) below. 67.88 78.67 69.88 84.75 80.16 85.91 101.91 98.56 i: a Click the icon to view the table of critical t-values. (3) Determine a point estimate for the population mean travel tax. A point estimate for the population mean travel tax is $ (Round to two decimal places as needed.) Table of Critical t-Values Area in f-Distribution Area in Right Tail Degrees of Freedom 0.25 0.20 0.025 0.01 0.005 0.0025 0.001 0.0005 1.000 1.963 3.078 6.314 12.706 31.821 53.657 127.32 1 318.309 636.619 0.816 1.886 2.920 4.303 4.849 6.965 9.925 14.089 22.327 31.599 0.978 1.250 1.638 2.353 3.182 3.482 4.541 5.841 7453 10.215 12.924 0.741 0.941 1.533 2.132 2.776 3.747 7173 8.610 D.727 0.920 1.156 1.476 2.015 2.757 3.365 4.773 5.893 6.869 0.718 0.906 1.134 1.440 2.612 3.143 3.707 4.317 5.206 5.959 0.711 0.896 2.517 2.998 3.499 4.029 D.706 0.880 1.108 1.397 1.860 2.306 2.449 2.896 3.355 3.833 0.703 1.100 1.383 2.262 2.398 2.821 10 0.700. 0.879 1.093 1.372 1.812 2.228 2.359 2.764 3.169 3.581 4.144 11 0.697 1.088 1.363 1.796 2.328 2.718 3.106 3.497 4.025 0.695 0.873 1.356 1.782 2.179 2.303 3.055 3.428 3.930 4.318 0.694 0.870 1.079 1.350 1.771 2.160 2.282 2.650 3.012 3.372 3.852 14 0.868 1.076 1345 2.624 3.326 4.140 15 0.866 1.074 1.341 1.753 2.131 2.249 2.602 2.947 3.286 3.733 4.073 16 0.690 0.865 1.07 1.337 1.746 2.120 2.235 2.583 3.252 3.686 4.015 17 18 0.689 0.863 1.069 1.333 2.110 2.224 2.567 2.898 3.222 3.646 3.965 0.688 0.862 1.330 1.734 2.101 2.214 2.552 2.878 3.197 3.610 3.922 19 0.688 1.066 1.328 1.720 2.093 2.205 2.539 2.861 3.174 3.579 3.883 20 0.860 1.064 1.325 2.086 2.197 2.528 2.845 3.850 0.686 0.859 1.063 1323 1.721 2.080 2.518 2.831 3.135 3.527 3.819 0.686 0.858 1.061 1.717 2.074 2.183 2.508 2.819 3.119 3.505 D.685 0.858 1.060 1.319 1.714 2.069 2.500 2.807 3.104 3.485 3.768 0.685 0.857 1.059 1.318 1.711 2.172 2.492 2.797 3.091 3.467 3.745 0.684 0.856 1.316 2.485 2.787 3.078 3.725 26 0.684 0.856 1.058 1.315 1.706 2.056 2.162 2.479 2.779 3.067 3.435 3.707 0.684 0.855 1.703 2.052 2.158 2.473 2.771 3.057 3.690 1712 1 71 Print DoneTable of Critical t-Values 0.866 L753 2.131 2.602 3.286 3.733 4073 16 0.690 0.865 2.120 2.235 2.583 2.921 3.252 3.686 4.015 17 0.689 0.863 1.333 2.898 3.222 3.965 18 1.067 1.330 1.734 2.101 2.214 2.552 2.878 3.197 3.610 3.922 19 1.066 1.328 2.093 2.205 3.579 3.883 20 0.687 0.860 1.064 1.325 2.086 2.197 2.845 3.552 3.850 0.686 0.859 1.063 1323 1.721 2.080 2.518 2.831 3.135 3.819 0.858 1.321 2.074 2.183 2.508 2.819 3.505 3.792 0.685 0.858 1.060 1.319 1.714 2.069 2.500 2.807 3.104 3.485 3.768 D.685 0.857 1.711 2.172 2.492 2.797 3.467 3.745 0.856 2.060 2.787 3.078 0.684 0.856 1.058 1.706 2.056 2.162 2.479 2.779 3.067 3.435 3.707 0.684 0.855 1.314 1.703 2.052 2.158 2.771 3.057 3.690 1.056 1.313 1.701 2.048 2.154 2.763 3.408 3.674 1.055 2.150 2.756 3.047 3.038 3.306 0.683 0.854 1.055 2.042 2.457 2.750 3.030 3.646 0.682 0.853 1.054 2.040 2.453 2.744 3.022 3.375 3.633 0.682 1.054 2.037 2.141 2.449 2.738 3.015 3.365 3.622 0.682 0.853 1.308 2.035 3.008 3.356 D.682 0.852 1.052 1.691 2.032 2.136 2.728 3.002 3.348 0.852 1.052 2.133 2.724 2.996 0.681 1.052 2.028 2.131 2.719 2.990 3.333 3.582 37 0.851 1.305 1.687 2.026 2.129 2.715 2.985 3.326 3.574 38 1.686 2.024 2.712 2.023 2708 3.319 0.851 1.050 2.976 3.313 3.558 40 0.681 1.684 2.423 2.971 3.551 50 0.679 0.849 1.047 1.209 1.676 2.009 2.678 2.937 3.261 3.496 0.679 1.296 1.671 2.000 2090 2.660 2.915 3.232 3.460 70 0.847 1.044 1.294 1.904 2.093 2.648 2.899 3.211 0.678 0.846 1.043 1.292 1.664 1.90 2.088 2.374 2.639 2.887 3.195 0.677 0.846 1.987 2.084 2.632 2.878 3.183 3.402 1010 0.845 1.042 1.984 2.626 3.174 3.390 1.037 1.646 1:96 2.330 2.581 3.098 3.300 0.674 0.842 1.282 1.961 2.054 2.807 3.090 0.20 0.15 0.10 0.05 0.025 0402 0.005 0.0025 0.001 0.0005 Freedom r-Distribution Area in Right Tail Print Done
Step by Step Solution
There are 3 Steps involved in it

Get step-by-step solutions from verified subject matter experts