

Question: I need help with a-d n have Homework 08 - Saved to my Mac ~ Insert Draw Design Layout References Mailings Review > Tell me
I need help with a-d
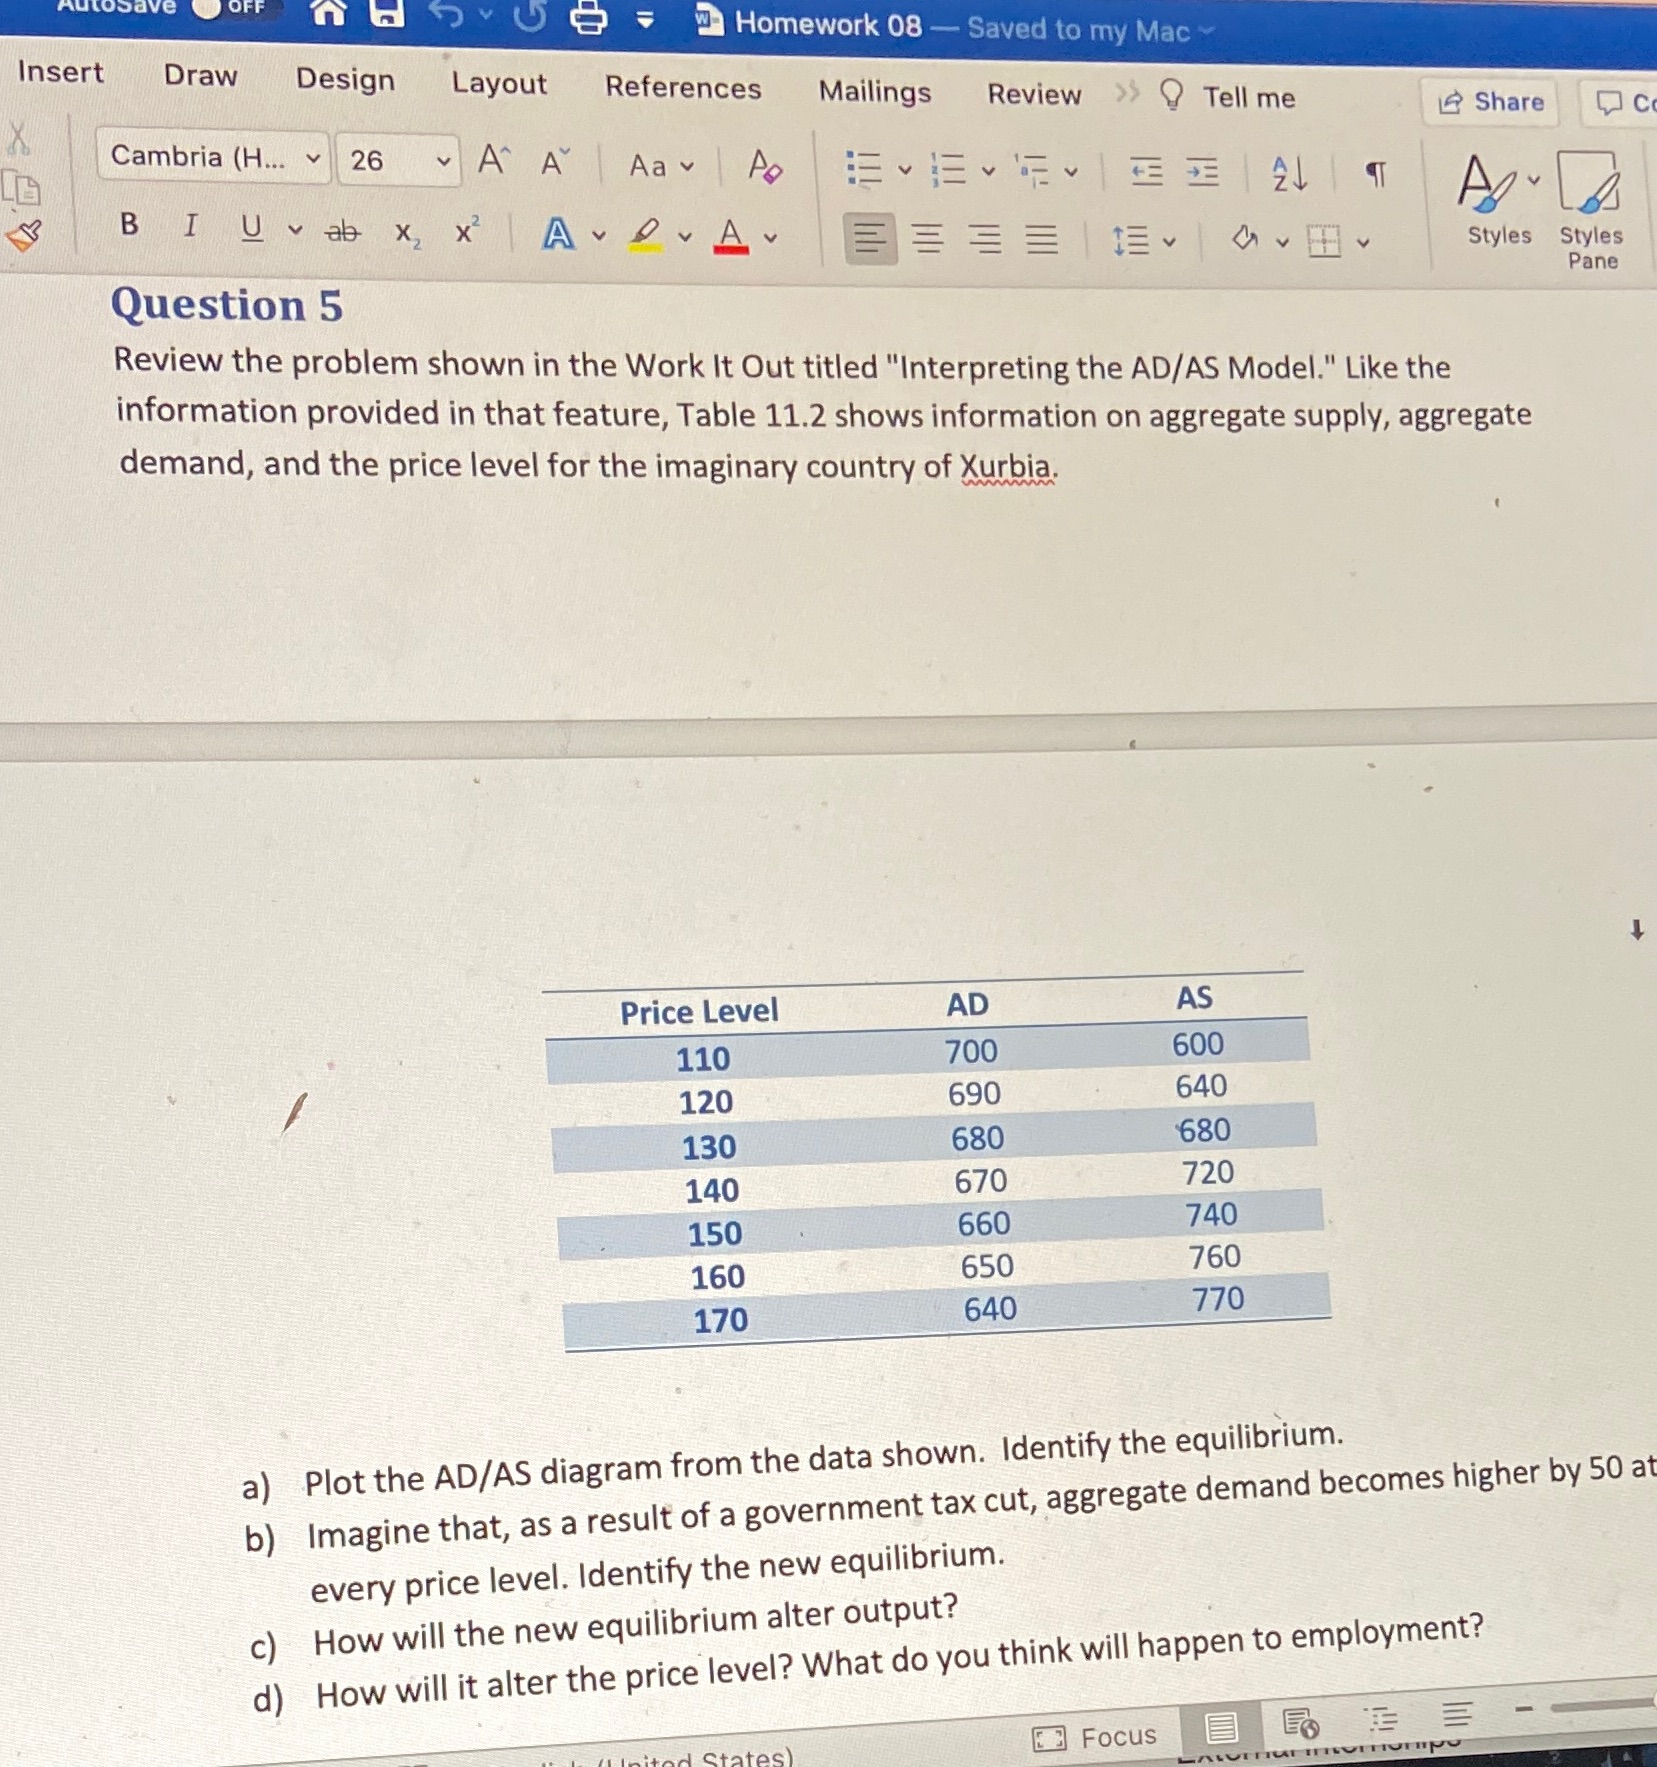
n have Homework 08 - Saved to my Mac ~ Insert Draw Design Layout References Mailings Review > Tell me Share C Cambria (H... 26 A A Aa Ap BI Uvab X X A LA E Styles Styles Pane Question 5 Review the problem shown in the Work It Out titled "Interpreting the AD/AS Model." Like the information provided in that feature, Table 11.2 shows information on aggregate supply, aggregate demand, and the price level for the imaginary country of Xurbia. Price Level AD AS 110 700 600 120 690 640 130 680 680 140 670 720 150 660 740 160 650 760 170 640 770 a) Plot the AD/AS diagram from the data shown. Identify the equilibrium. b) Imagine that, as a result of a government tax cut, aggregate demand becomes higher by 50 at every price level. Identify the new equilibrium. c) How will the new equilibrium alter output? d) How will it alter the price level? What do you think will happen to employment? Focus E
Step by Step Solution
There are 3 Steps involved in it

Get step-by-step solutions from verified subject matter experts