

Question: I need help with a-f A chemist has a 100gram sample of a radioactive material. He records the amount (a) Treating week, x, as the
I need help with a-f
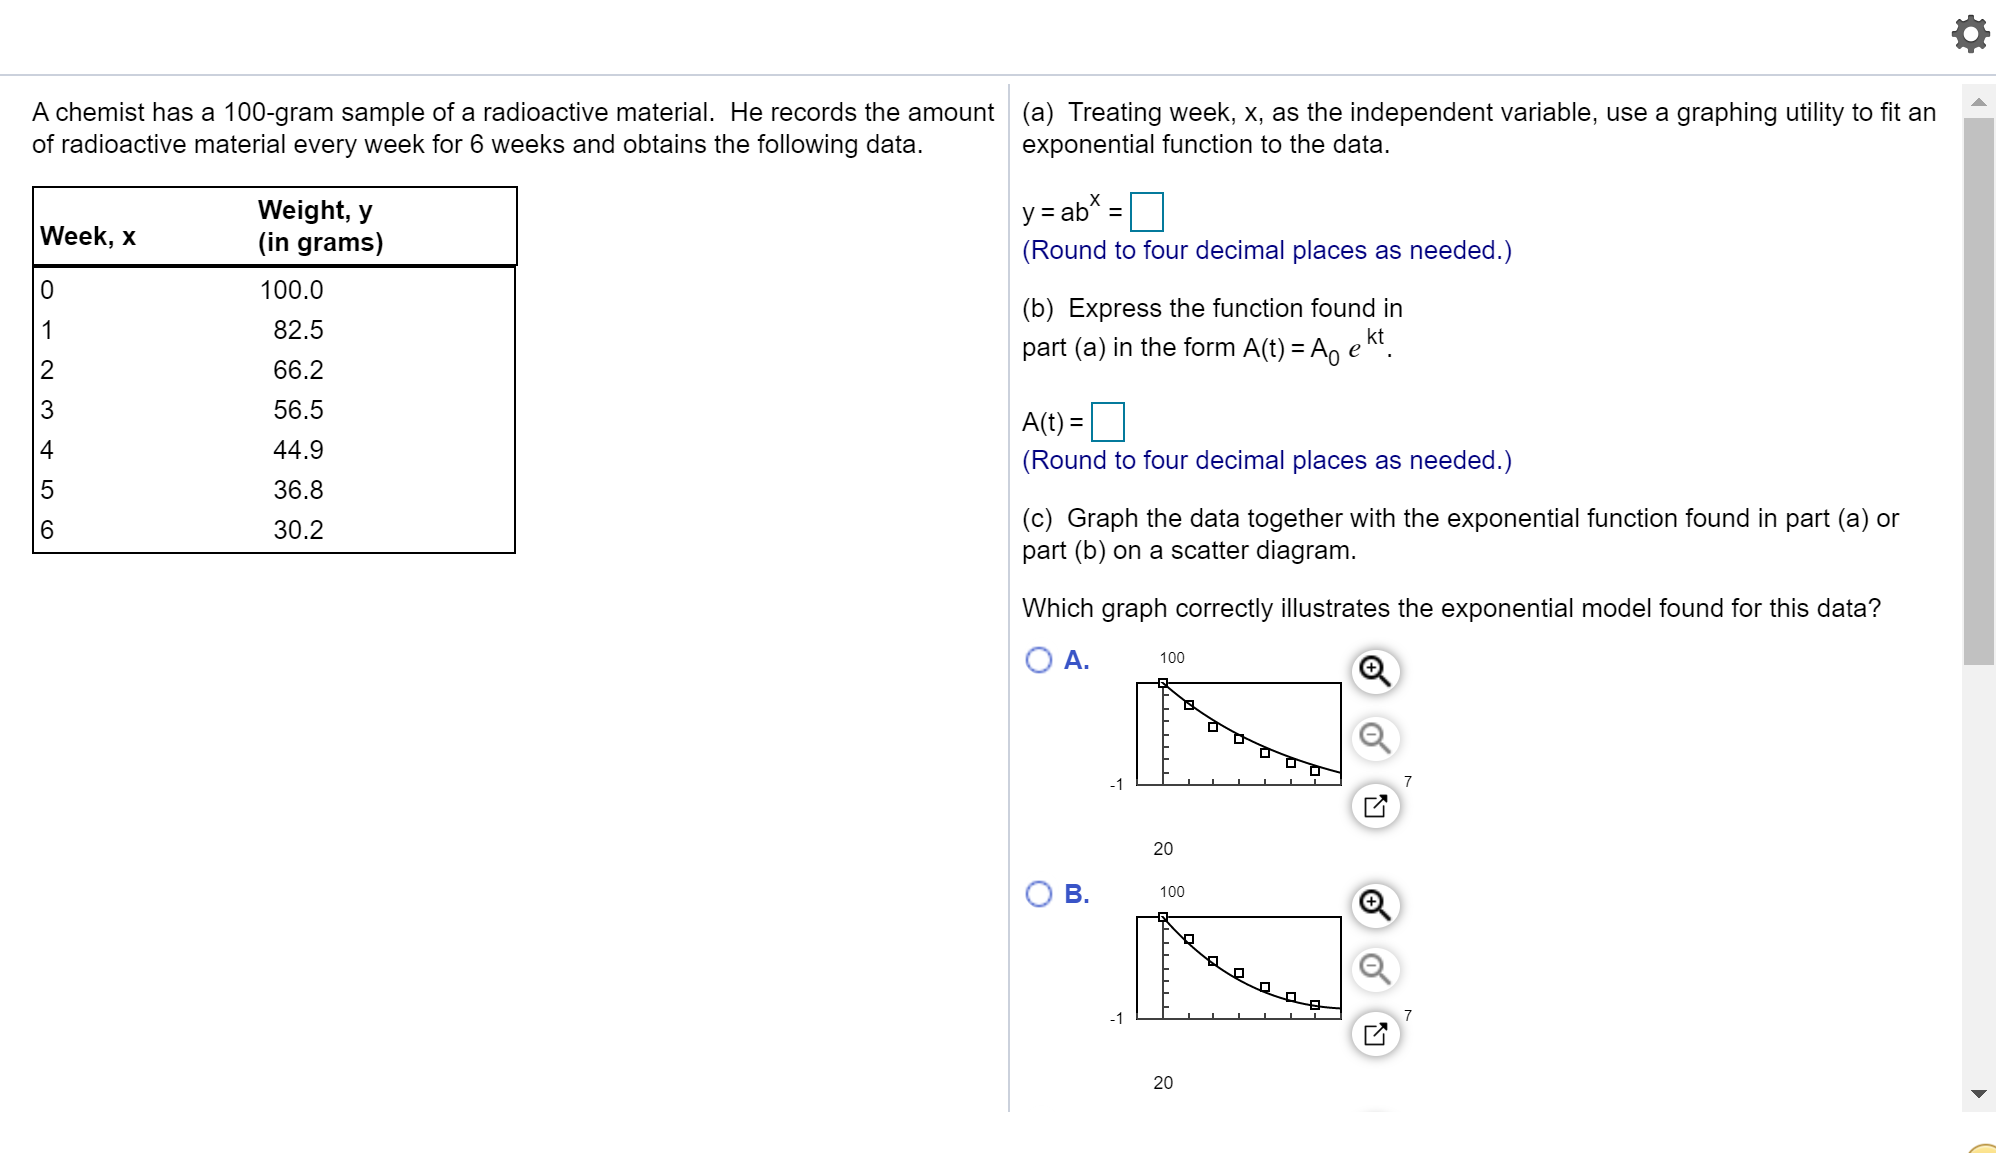
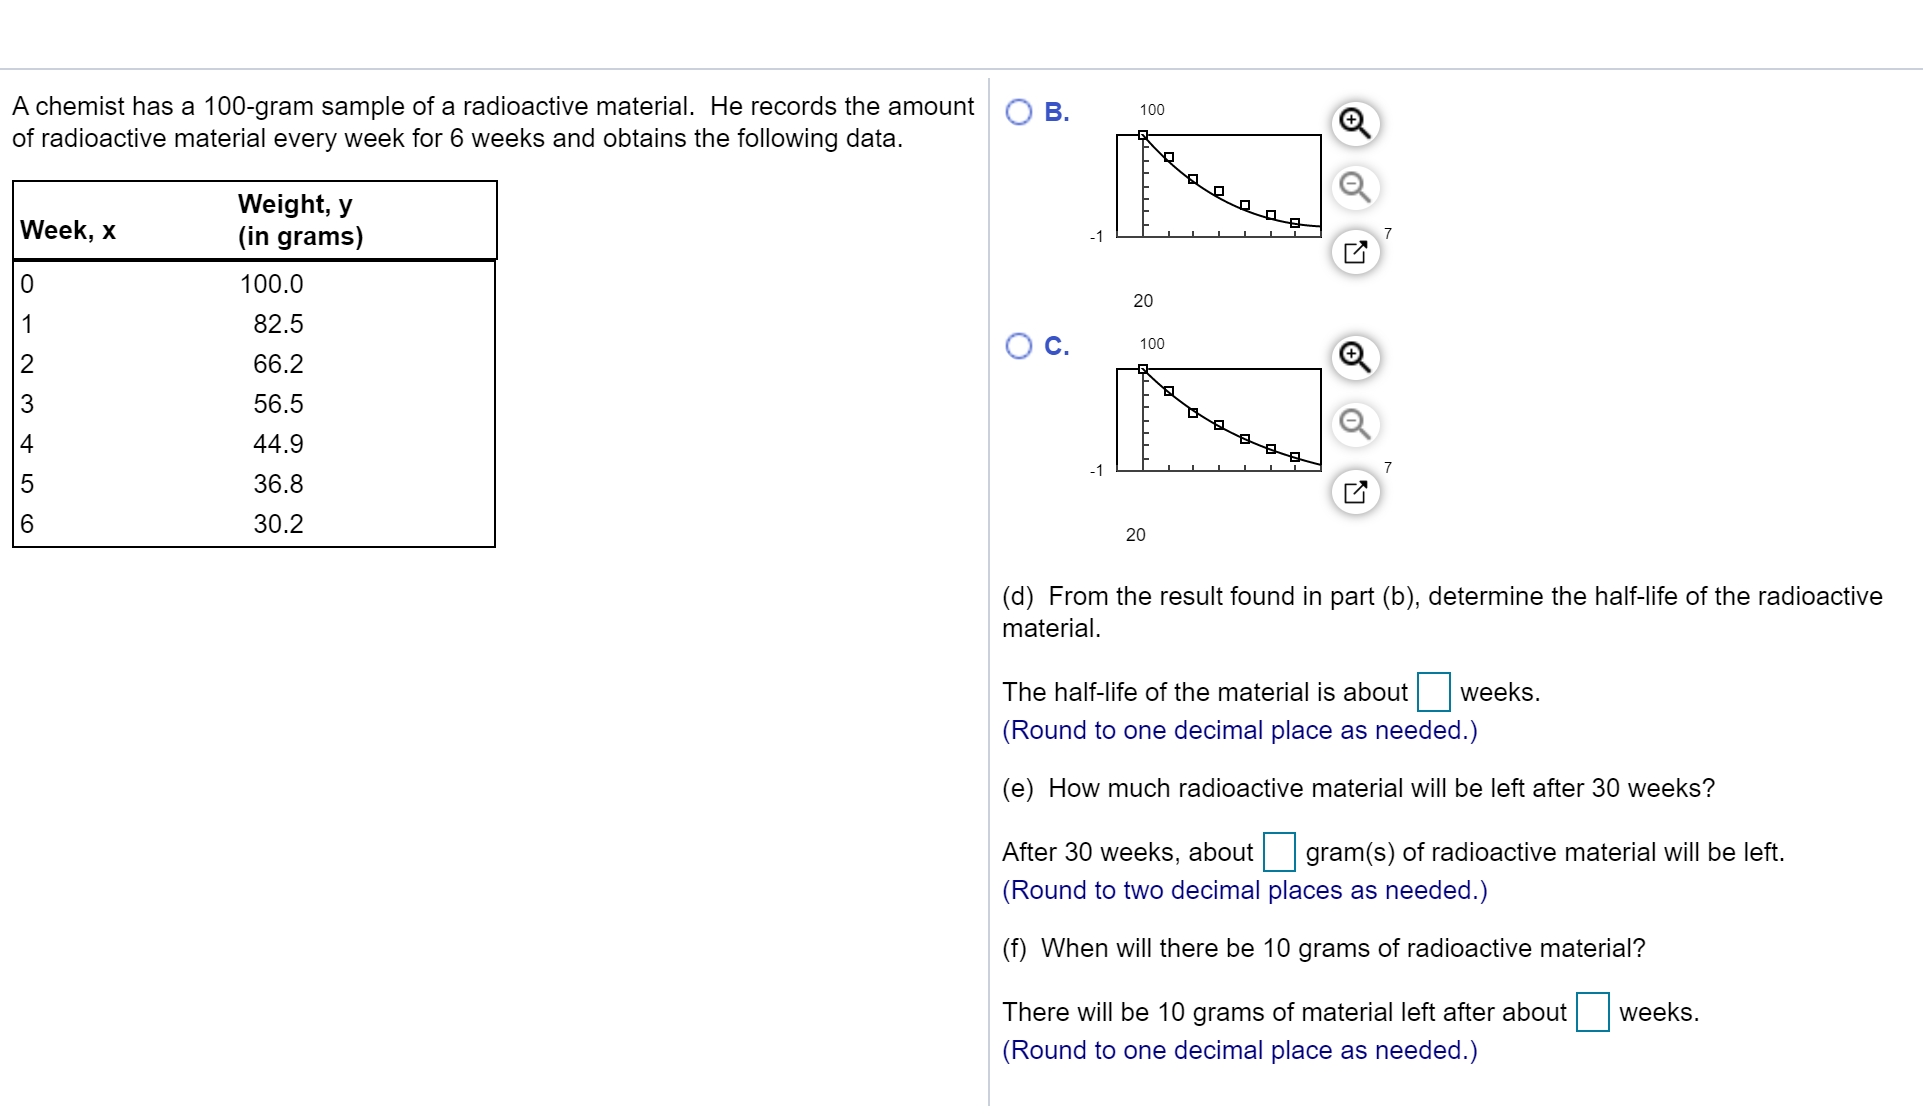
A chemist has a 100gram sample of a radioactive material. He records the amount (a) Treating week, x, as the independent variable, use a graphing utility to t an of radioactive material every week for 6 weeks and obtains the following data. exponential function to the data. Weight, y y : ab" = D (In grams) (Round to four decimal places as needed.) (b) Express the function found in part (a) in the form A(t) = A0 6 k'. A(1)= (Round to four decimal places as needed.) (0) Graph the data together with the exponential function found in part (a) or part (b) on a scatter diagram. Which graph correctly illustrates the exponential model found for this data? 0 A. 100 Q 20 A chemist has a 100gram sample of a radioactive material. He records the amount 0 B. me Q of radioactive material every week for 6 weeks and obtains the following data. Weight, y (in grams) 20 (d) From the result found in part (b), determine the half-life of the radioactive material. The halflife of the material is about El weeks. (Round to one decimal place as needed.) (e) How much radioactive material will be left after 30 weeks? After 30 weeks, about D gram(s) of radioactive material will be left. (Round to two decimal places as needed.) (f) When will there be 10 grams of radioactive material'? There will be 10 grams of material left after about D weeks. (Round to one decimal place as needed.)
Step by Step Solution
There are 3 Steps involved in it

Get step-by-step solutions from verified subject matter experts