

Question: I need help with calculating these two outputs. Group Statistics Std. Error RESPONDENTS SEX N Mean Std. Deviation Mean HOURS PER DAY MALE 437 3.14
I need help with calculating these two outputs.
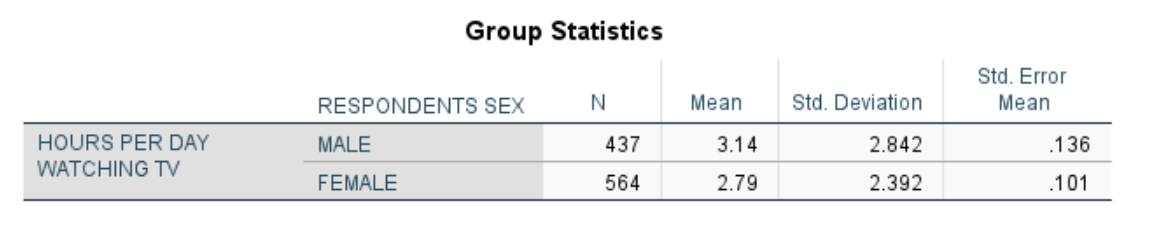

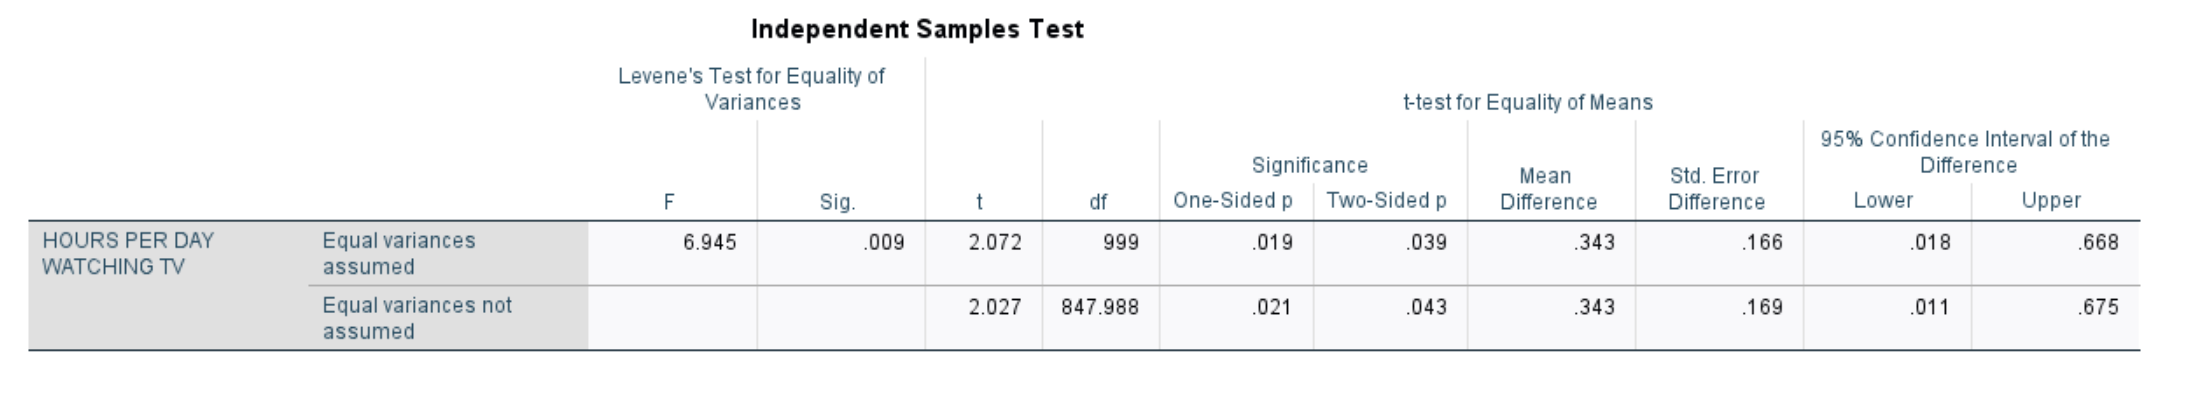
Group Statistics Std. Error RESPONDENTS SEX N Mean Std. Deviation Mean HOURS PER DAY MALE 437 3.14 2.842 .136 WATCHING TV FEMALE 564 2.79 2.392 .101Independent Samples Test Levene's Test for Equality of Variances t-test for Equality of Means 95% Confidence Interval of the Significance Mean Std. Error Difference F Sig. df One-Sided p Two-Sided p Difference Difference Lower Upper HOURS PER DAY Equal variances 6.945 009 2.072 999 019 039 343 166 018 668 WATCHING TV assumed Equal variances not 2.027 847.988 021 .043 .343 .169 011 675 assumed
Step by Step Solution
There are 3 Steps involved in it
1 Expert Approved Answer
Step: 1 Unlock

Question Has Been Solved by an Expert!
Get step-by-step solutions from verified subject matter experts
Step: 2 Unlock
Step: 3 Unlock