

Question: I need help with describing python plots. They deal with Neural Network Regression (tanh) with machine learning. I think the first plot deals with errors.
I need help with describing python plots. They deal with Neural Network Regression (tanh) with machine learning. I think the first plot deals with errors. The second plot shows how accurate the neural network was. The last plot I have no clue. Please provide a better description of the three plots than what I have already described as well as what do you see when you look at these plots in terms of neural network regression.
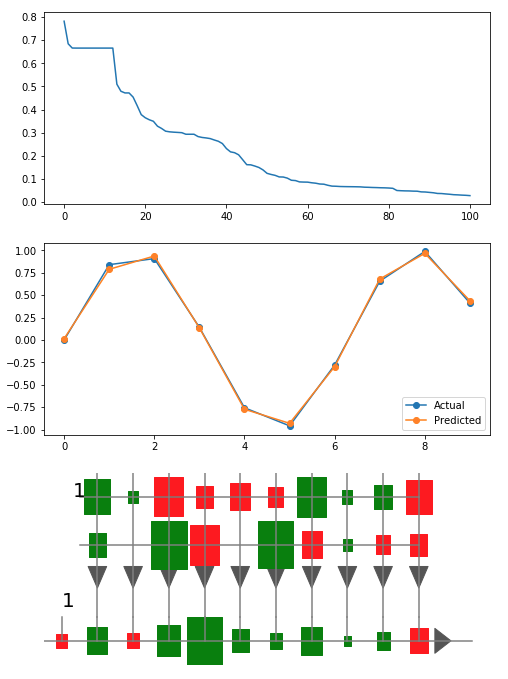
0.8 0.7 0.6 0.5 0.4 0.3 0.2 0.1 0.0 20 40 60 80 100 100 0.75 0.50 0.25 0.00 -0.25 -0.50 -0.75 Actual Predicted 0.8 0.7 0.6 0.5 0.4 0.3 0.2 0.1 0.0 20 40 60 80 100 100 0.75 0.50 0.25 0.00 -0.25 -0.50 -0.75 Actual Predicted
Step by Step Solution
There are 3 Steps involved in it
To describe the plots related to a Neural Network Regression using the tanh activation function lets go through each one Top Plot Error Plot Descripti... View full answer

Get step-by-step solutions from verified subject matter experts