

Question: i need help with getting these numbers for these formulas, i will give you a ! please answer asap Selling and Administrative Expense Budget For
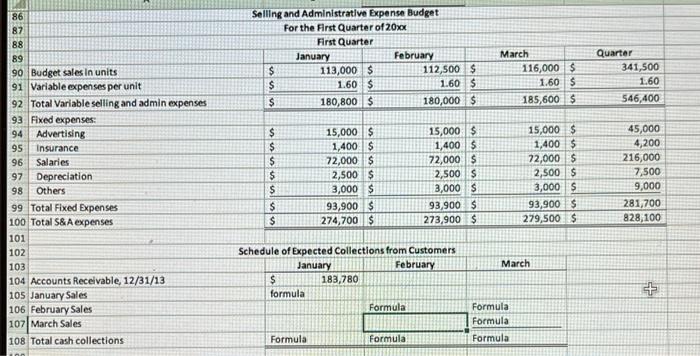
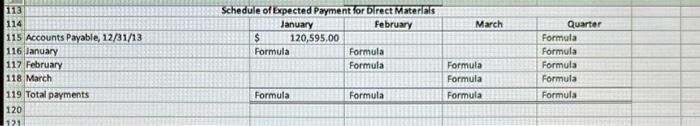
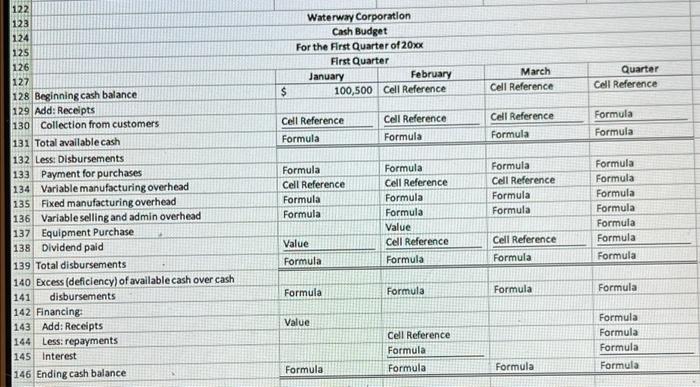
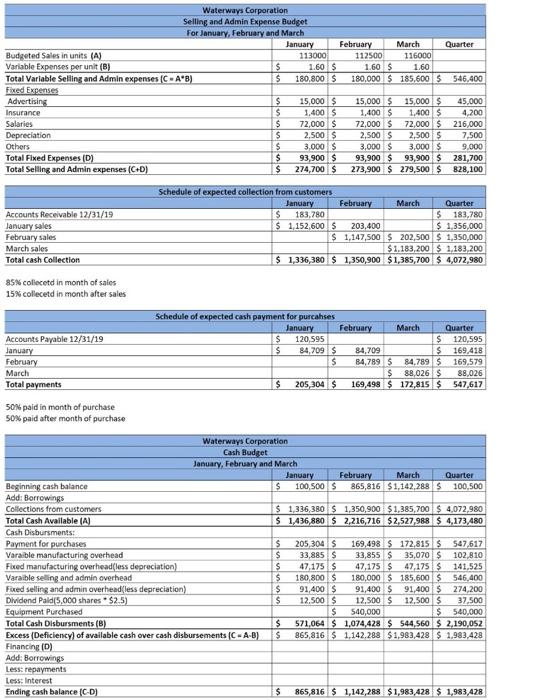
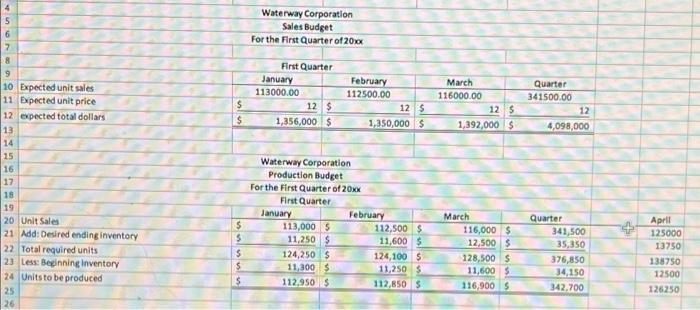
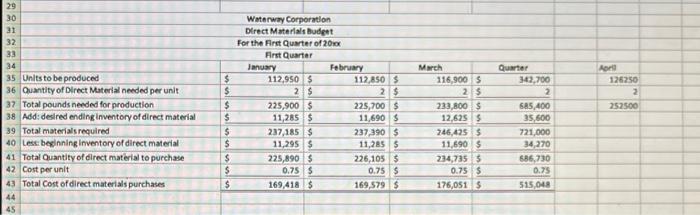
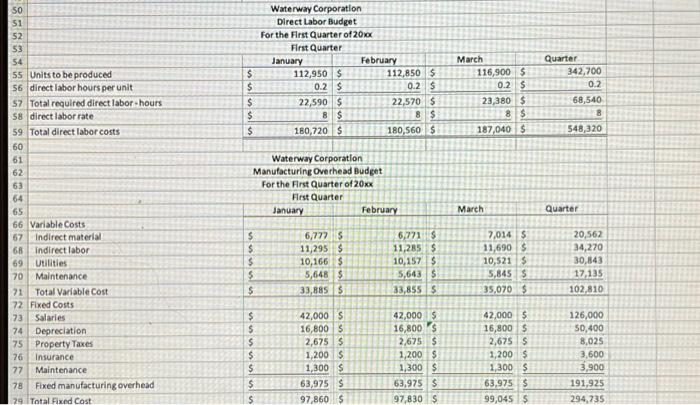
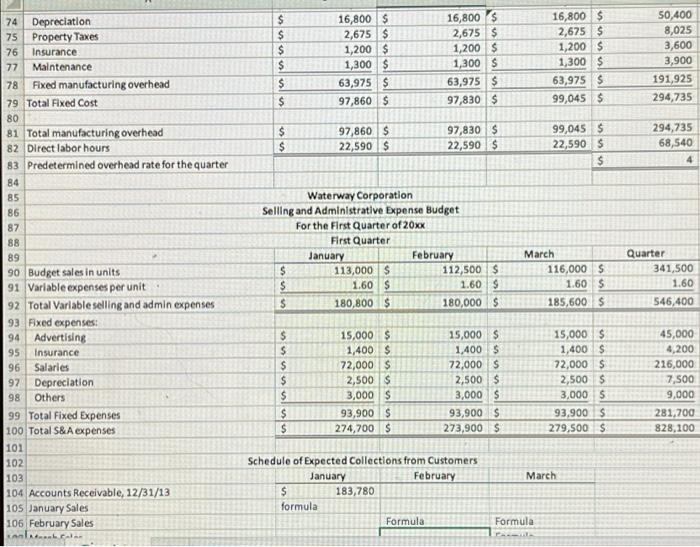
Selling and Administrative Expense Budget For the First Quarter of 20xx First Quarter January February $ 113,000 $ 112,500 $ $ 1.60 $ 1.60 $ $ 180,800 $ 180,000 $ March 116,000 $ 1.60 $ 185,600 Quarter 341,500 1.60 546,400 86 87 88 89 90 Budget sales in units 91 Variable expenses per unit 92 Total Variable selling and admin expenses 93 Fixed expenses: 94 Advertising 95 Insurance 96 Salaries 97 Depreciation 98 Others 99 Total Fixed Expenses 100 Total S&A expenses 101 102 103 104 Accounts Receivable 12/31/13 105 January Sales 106 February Sales 107 March Sales 108 Total cash collections $ $ $ $ $ $ $ 15,000 $ 1,400$ 72,000 $ 2,500 $ 3,000 $ 93,900 $ 274,700S 15,000 $ 1,400 $ 72,000 $ 2,500S 3,000 $ 93,900 $ 273,900 $ 15,000 $ 1,400 $ 72,000 $ 2,500 S 3,000 S 93,900 $ 279,500 $ 45,000 4,200 216,000 7,500 9,000 281,700 828,100 March Schedule of Expected Collections from Customers January February $ 183,780 formula Formula + + Formula Formula Formula Formula Formula March 113 114 115 Accounts Payable, 12/31/13 116 January 117 February 118 March 119 Total payments 120 121 Schedule of Expected Payment for Direct Materials January February $ 120,595,00 Formula Formula Formula Formula Formula Quarter Formula Formula Formula Formula Formula Formula Formula Formula Waterway Corporation Cash Budget For the First Quarter of 20xx First Quarter January February 100,500 Cell Reference March Cell Reference Quarter Cell Reference $ Call Reference Cell Reference Formula Cell Reference Formula Formula Formula Formula 122 123 124 125 126 127 128 Beginning cash balance 129 Add: Receipts 130 Collection from customers 131 Total available cash 132 Less: Disbursements 133 Payment for purchases 134 Variable manufacturing overhead 135 Fixed manufacturing overhead 136 Variable selling and admin overhead 137 Equipment Purchase 138 Dividend paid 139 Total disbursements 140 Excess (deficiency) of available cash over cash 141 disbursements 142 Financing 143 Add: Receipts 144 Less: repayments 145 Interest 146 Ending cash balance Formula Cell Reference Formula Formula Formula Cell Reference Formula Formula Value Cell Reference Formula Formula Cell Reference Formula Formula Formula Formula Formula Formula Formula Formula Formula Value Formula Cell Reference Formula Formula Formula Formula Formula Value Cell Reference Formula Formula Formula Formula Formula Formula Formula Formula Waterways Corporation Selling and Admin Expense Budget For January, February and March January February March Quarter Budgeted Sales in units (A) 113000 112500 116000 Variable Expenses per unit (8) $ 1.60 $ 1.60 $ 1.60 Total Variable Selling and Admin expenses (C = A'B) $ 180,800 $ 180.000 $ 185,600 $546,400 Fixed Expenses Advertising $ 15,000 $ 15,000 $ 15,000 $ 45,000 Insurance $ 1.400 1.400 1,400 $ 4.200 Salaries $ 72,000 $ 72,000 $ 72,000 $216,000 Depreciation $ 2,500 $ 2,500 $ 2,500 $ 7,500 Others $ 3,000 $ 3,000 $ 3,000 $ 9.000 Total Fixed Expenses (D) $ 93,900 $ 93,900 $ 93,900 $281,700 Total Selling and Admin expenses (C+D) $ 274,700 S 273,900 $ 279,500 $ 828,100 Accounts Receivable 12/31/19 January sales February sales March sales Total cash Collection Schedule of expected collection from customers January February March Quarter $ 183,780 $ 183,780 $ 1,152,600 $ 203,400 $ 1,356,000 $ 1,147,500 $ 202,500 $ 1,350,000 $ 1.183,200 $ 1.183,200 $ 1,336,380 $ 1,350,900 $1,385,700 $ 4,072,980 85% collecet in month of sales 15% collecet in month after sales Accounts Payable 12/31/19 January February March Total payments Schedule of expected cash payment for purcahses January February March Quarter $ 120,595 $ 120,595 $ 84,709 84,709 $ 169,418 $ 84,789 $ 84,789 $ 169,579 $ 88,026 $ 88,026 $ 205,304 169,498 $ 172,815 $ 547,617 50% paid in month of purchase 50% paid after month of purchase Waterways Corporation Cash Budget January, February and March January February March Quarter Beginning cash balance $ 100,500S 865,816 $1,142,288S 100.500 Add: Borrowings Collections from customers $ 1,336,380 $ 1,350,900 $1,385,700 $ 4,072,980 Total Cash Available (A) $ 1,436,880 $ 2,216,716 $2,527,988 $ 4,173,480 Cash Disbursments: Payment for purchases $ 205,304 5 169,498 $ 172,815 547,617 Varaible manufacturing overhead $ 33,885 S 33,855 $ 35,070 $ 102,810 Fixed manufacturing overheadless depreciation) $ 47,175 S 47,175 $ 47,175 141.525 Varaible selling and admin overhead $ 180,800 $ 180,000 $ 185,600 $546,400 Fixed selling and admin overheadless depreciation) $ 91,400 S 91,400 $ 91,4005 274,200 Dividend Paid 5,000 shares $2.5) $ 12.500 $ 12.500 $ 12,500 $ 37.500 Equipment Purchased $ 540,000 $ 540,000 Total Cash Disbursments (B) $ 571,064 $1,074,428 $544,560 $ 2.190,052 Excess (Deficiency) of available cash over cash disbursements (C-A-B) $ 865,816 $ 1,142.288 $ 1,983,428 $ 1,983,428 Financing (D) Add: Borrowings Less: repayments Less: Interest Ending cash balance (CD) $ 865,816 $ 1,142,288 $1,983,428 $ 1,983,428 4 5 6 Waterway Corporation Sales Budget For the First Quarter of 20xx First Quarter January 113000.00 12 $ 1,356,000 $ $ February 112500.00 12 5 1,350,000 $ March 116000.00 12 5 1,392,000 $ Quarter 341500.00 12 4,098,000 7 8 9 10 Expected unit sales 11 Expected unit price 12 expected total dollars 13 14 15 16 17 18 19 20 Unit Sales 21 Add: Desired ending inventory 22 Total required units 23 Less: Beginning inventory 24 Units to be produced 25 26 $ $ $ $ $ Waterway Corporation Production Budget For the First Quarter of 20xx First Quarter January February 113,000 5 112,500 $ 11,250 $ 11,600 $ 124,250 $ 124,100 $ 11,300 $ 11,250 $ 112,950 $ 112,850 S March 116,000 $ 12,500 $ 128,500 $ 11,600 $ 116,900 $ Quarter 341,500 35,350 376,850 34,150 342,700 April 125000 13750 138750 12500 126250 29 30 31 32 33 April 126250 2 252500 35 Units to be produced 36 Quantity of Direct Material needed per unit 37 Total pounds needed for production 38 Add: desired ending inventory of direct material 39 Total materials required 40 Less: beginning inventory of direct material 41 Total Quantity of direct material to purchase 42 Cost per unit 43 Total Cost of direct materials purchases 44 45 Waterway Corporation Direct Materials budget For the First Quarter of 20 x First Quarter January February 112,950 $ 112,850 $ 2 $ 2 $ 225,900 $ 225,700 $ 11,285 $ 11,690$ 237,185 237,3905 11,295 $ 11,2855 225,890$ 226,1055 0.75$ 0.75$ 169,418$ 169,579 $ $ $ $ $ $ $ $ $ $ March 116,900 5 25 233,800 $ 12,625 $ 246,4253 11.690 $ 234,7355 0.75$ 176,051 5 Quarter 342,700 2 685.400 35,600 721,000 34,270 686,730 0.75 515,048 Waterway Corporation Direct Labor Budget For the First Quarter of 2014 First Quarter January February 112,950 $ 112,850 S 0.2 S 0.2 $ 22,590 $ 22,570 S 8 $ 8 $ 180,720 S 180,560 $ Quarter 342,700 $ $ $ $ $ 0.2 March 116,900 $ 0.2 $ 23,380 $ 8 $ 187,040 $ 68,540 548,320 50 51 52 53 54 55 Units to be produced 56 direct labor hours per unit 57 Total required direct labor. hours 58 direct labor rate 59 Total direct labor costs 60 61 62 63 64 65 66 Variable Costs 57 Indirect material 68 Indirect labor 69 Utilities 70 Maintenance 71 Total Variable Cost 72 Fixed Costs 73 Salaries 74 Depreciation 75 Property Taxes 76 Insurance 77 Maintenance 78 Fixed manufacturing overhead 29 Total Fixed Cost Waterway Corporation Manufacturing Overhead Budget For the First Quarter of 20xx First Quarter January February March Quarter $ $ $ $ $ 6,777 S 11,295 $ 10,166 $ 5,648$ 33,8855 6,721 11,285 $ 10,157 $ 5,643 S 33,8555 7,014 S 11,690$ 10,5215 5,845 5 35.070 20,562 34,270 30,843 17,135 102,810 $ S $ $ $ $ 42,000 $ 16,800 2,675 S 1,200 $ 1,300 $ 63,975 S 97,860 S 42,000 $ 16,800$ 2,675$ 1,200 $ 1,300 $ 63,975 $ 97,830 S 42,000 $ 16,800 $ 2,675 S 1,200 $ 1,300 $ 63,9755 99,0455 126,000 50,400 8,025 3,600 3,900 191,925 294,735 S $ $ $ $ $ usuu vil 16,800 $ 2,675$ 1,200 $ 1,300 $ 63,975 $ 97,860 $ 16,800 $ 2,675 $ 1,200 $ 1,300 $ 63,975 $ 97,830 $ 16,800 $ 2,675 $ 1,200 $ 1,300 $ 63,975 S 99,045 $ 50,400 8,025 3,600 3,900 191,925 294,735 $ $ $ 97,860S 22,590 $ 97,830$ 22,590 $ 99,045 $ 22,590S $ 294,735 68,540 74 Depreciation 75 Property Taxes 76 Insurance 77 Maintenance 78 Fixed manufacturing overhead 79 Total Fixed Cost 80 81 Total manufacturing overhead 82 Direct labor hours 83 Predetermined overhead rate for the quarter 84 85 86 87 88 89 90 Budget sales in units 91 Variable expenses per unit 92 Total Variable selling and admin expenses 93 Fixed expenses 94 Advertising 95 Insurance 96 Salaries 97 Depreciation 98 Others 99 Total Fixed Expenses 100 Total S&A expenses 101 102 103 104 Accounts Receivable, 12/31/13 105 January Sales 106 February Sales Waterway Corporation Selling and Administrative Expense Budget For the First Quarter of 20xx First Quarter January February $ 113,000 $ 112,500 $ $ 1.60 $ 1.60 $ $ 180,800 $ 180,000 $ March 116,000 $ 1.60 $ 185,600 $ Quarter 341,500 1.60 546,400 $ $ $ $ $ $ $ 15,000 $ 1,400 $ 72,000 $ 2,500 $ 3,000 $ 93,900 $ 274,700 $ 15,000 $ 1,400 5 72,000 $ 2,500 $ 3,000 $ 93,900 $ 273,900 $ 15,000 $ 1,400 $ 72,000 $ 2,500 $ 3,000 $ 93,900 $ 279,500 $ 45,000 4,200 216,000 7,500 9,000 281,700 828,100 March Schedule of Expected Collections from Customers January February $ 183,780 formula Formula Formula Selling and Administrative Expense Budget For the First Quarter of 20xx First Quarter January February $ 113,000 $ 112,500 $ $ 1.60 $ 1.60 $ $ 180,800 $ 180,000 $ March 116,000 $ 1.60 $ 185,600 Quarter 341,500 1.60 546,400 86 87 88 89 90 Budget sales in units 91 Variable expenses per unit 92 Total Variable selling and admin expenses 93 Fixed expenses: 94 Advertising 95 Insurance 96 Salaries 97 Depreciation 98 Others 99 Total Fixed Expenses 100 Total S&A expenses 101 102 103 104 Accounts Receivable 12/31/13 105 January Sales 106 February Sales 107 March Sales 108 Total cash collections $ $ $ $ $ $ $ 15,000 $ 1,400$ 72,000 $ 2,500 $ 3,000 $ 93,900 $ 274,700S 15,000 $ 1,400 $ 72,000 $ 2,500S 3,000 $ 93,900 $ 273,900 $ 15,000 $ 1,400 $ 72,000 $ 2,500 S 3,000 S 93,900 $ 279,500 $ 45,000 4,200 216,000 7,500 9,000 281,700 828,100 March Schedule of Expected Collections from Customers January February $ 183,780 formula Formula + + Formula Formula Formula Formula Formula March 113 114 115 Accounts Payable, 12/31/13 116 January 117 February 118 March 119 Total payments 120 121 Schedule of Expected Payment for Direct Materials January February $ 120,595,00 Formula Formula Formula Formula Formula Quarter Formula Formula Formula Formula Formula Formula Formula Formula Waterway Corporation Cash Budget For the First Quarter of 20xx First Quarter January February 100,500 Cell Reference March Cell Reference Quarter Cell Reference $ Call Reference Cell Reference Formula Cell Reference Formula Formula Formula Formula 122 123 124 125 126 127 128 Beginning cash balance 129 Add: Receipts 130 Collection from customers 131 Total available cash 132 Less: Disbursements 133 Payment for purchases 134 Variable manufacturing overhead 135 Fixed manufacturing overhead 136 Variable selling and admin overhead 137 Equipment Purchase 138 Dividend paid 139 Total disbursements 140 Excess (deficiency) of available cash over cash 141 disbursements 142 Financing 143 Add: Receipts 144 Less: repayments 145 Interest 146 Ending cash balance Formula Cell Reference Formula Formula Formula Cell Reference Formula Formula Value Cell Reference Formula Formula Cell Reference Formula Formula Formula Formula Formula Formula Formula Formula Formula Value Formula Cell Reference Formula Formula Formula Formula Formula Value Cell Reference Formula Formula Formula Formula Formula Formula Formula Formula Waterways Corporation Selling and Admin Expense Budget For January, February and March January February March Quarter Budgeted Sales in units (A) 113000 112500 116000 Variable Expenses per unit (8) $ 1.60 $ 1.60 $ 1.60 Total Variable Selling and Admin expenses (C = A'B) $ 180,800 $ 180.000 $ 185,600 $546,400 Fixed Expenses Advertising $ 15,000 $ 15,000 $ 15,000 $ 45,000 Insurance $ 1.400 1.400 1,400 $ 4.200 Salaries $ 72,000 $ 72,000 $ 72,000 $216,000 Depreciation $ 2,500 $ 2,500 $ 2,500 $ 7,500 Others $ 3,000 $ 3,000 $ 3,000 $ 9.000 Total Fixed Expenses (D) $ 93,900 $ 93,900 $ 93,900 $281,700 Total Selling and Admin expenses (C+D) $ 274,700 S 273,900 $ 279,500 $ 828,100 Accounts Receivable 12/31/19 January sales February sales March sales Total cash Collection Schedule of expected collection from customers January February March Quarter $ 183,780 $ 183,780 $ 1,152,600 $ 203,400 $ 1,356,000 $ 1,147,500 $ 202,500 $ 1,350,000 $ 1.183,200 $ 1.183,200 $ 1,336,380 $ 1,350,900 $1,385,700 $ 4,072,980 85% collecet in month of sales 15% collecet in month after sales Accounts Payable 12/31/19 January February March Total payments Schedule of expected cash payment for purcahses January February March Quarter $ 120,595 $ 120,595 $ 84,709 84,709 $ 169,418 $ 84,789 $ 84,789 $ 169,579 $ 88,026 $ 88,026 $ 205,304 169,498 $ 172,815 $ 547,617 50% paid in month of purchase 50% paid after month of purchase Waterways Corporation Cash Budget January, February and March January February March Quarter Beginning cash balance $ 100,500S 865,816 $1,142,288S 100.500 Add: Borrowings Collections from customers $ 1,336,380 $ 1,350,900 $1,385,700 $ 4,072,980 Total Cash Available (A) $ 1,436,880 $ 2,216,716 $2,527,988 $ 4,173,480 Cash Disbursments: Payment for purchases $ 205,304 5 169,498 $ 172,815 547,617 Varaible manufacturing overhead $ 33,885 S 33,855 $ 35,070 $ 102,810 Fixed manufacturing overheadless depreciation) $ 47,175 S 47,175 $ 47,175 141.525 Varaible selling and admin overhead $ 180,800 $ 180,000 $ 185,600 $546,400 Fixed selling and admin overheadless depreciation) $ 91,400 S 91,400 $ 91,4005 274,200 Dividend Paid 5,000 shares $2.5) $ 12.500 $ 12.500 $ 12,500 $ 37.500 Equipment Purchased $ 540,000 $ 540,000 Total Cash Disbursments (B) $ 571,064 $1,074,428 $544,560 $ 2.190,052 Excess (Deficiency) of available cash over cash disbursements (C-A-B) $ 865,816 $ 1,142.288 $ 1,983,428 $ 1,983,428 Financing (D) Add: Borrowings Less: repayments Less: Interest Ending cash balance (CD) $ 865,816 $ 1,142,288 $1,983,428 $ 1,983,428 4 5 6 Waterway Corporation Sales Budget For the First Quarter of 20xx First Quarter January 113000.00 12 $ 1,356,000 $ $ February 112500.00 12 5 1,350,000 $ March 116000.00 12 5 1,392,000 $ Quarter 341500.00 12 4,098,000 7 8 9 10 Expected unit sales 11 Expected unit price 12 expected total dollars 13 14 15 16 17 18 19 20 Unit Sales 21 Add: Desired ending inventory 22 Total required units 23 Less: Beginning inventory 24 Units to be produced 25 26 $ $ $ $ $ Waterway Corporation Production Budget For the First Quarter of 20xx First Quarter January February 113,000 5 112,500 $ 11,250 $ 11,600 $ 124,250 $ 124,100 $ 11,300 $ 11,250 $ 112,950 $ 112,850 S March 116,000 $ 12,500 $ 128,500 $ 11,600 $ 116,900 $ Quarter 341,500 35,350 376,850 34,150 342,700 April 125000 13750 138750 12500 126250 29 30 31 32 33 April 126250 2 252500 35 Units to be produced 36 Quantity of Direct Material needed per unit 37 Total pounds needed for production 38 Add: desired ending inventory of direct material 39 Total materials required 40 Less: beginning inventory of direct material 41 Total Quantity of direct material to purchase 42 Cost per unit 43 Total Cost of direct materials purchases 44 45 Waterway Corporation Direct Materials budget For the First Quarter of 20 x First Quarter January February 112,950 $ 112,850 $ 2 $ 2 $ 225,900 $ 225,700 $ 11,285 $ 11,690$ 237,185 237,3905 11,295 $ 11,2855 225,890$ 226,1055 0.75$ 0.75$ 169,418$ 169,579 $ $ $ $ $ $ $ $ $ $ March 116,900 5 25 233,800 $ 12,625 $ 246,4253 11.690 $ 234,7355 0.75$ 176,051 5 Quarter 342,700 2 685.400 35,600 721,000 34,270 686,730 0.75 515,048 Waterway Corporation Direct Labor Budget For the First Quarter of 2014 First Quarter January February 112,950 $ 112,850 S 0.2 S 0.2 $ 22,590 $ 22,570 S 8 $ 8 $ 180,720 S 180,560 $ Quarter 342,700 $ $ $ $ $ 0.2 March 116,900 $ 0.2 $ 23,380 $ 8 $ 187,040 $ 68,540 548,320 50 51 52 53 54 55 Units to be produced 56 direct labor hours per unit 57 Total required direct labor. hours 58 direct labor rate 59 Total direct labor costs 60 61 62 63 64 65 66 Variable Costs 57 Indirect material 68 Indirect labor 69 Utilities 70 Maintenance 71 Total Variable Cost 72 Fixed Costs 73 Salaries 74 Depreciation 75 Property Taxes 76 Insurance 77 Maintenance 78 Fixed manufacturing overhead 29 Total Fixed Cost Waterway Corporation Manufacturing Overhead Budget For the First Quarter of 20xx First Quarter January February March Quarter $ $ $ $ $ 6,777 S 11,295 $ 10,166 $ 5,648$ 33,8855 6,721 11,285 $ 10,157 $ 5,643 S 33,8555 7,014 S 11,690$ 10,5215 5,845 5 35.070 20,562 34,270 30,843 17,135 102,810 $ S $ $ $ $ 42,000 $ 16,800 2,675 S 1,200 $ 1,300 $ 63,975 S 97,860 S 42,000 $ 16,800$ 2,675$ 1,200 $ 1,300 $ 63,975 $ 97,830 S 42,000 $ 16,800 $ 2,675 S 1,200 $ 1,300 $ 63,9755 99,0455 126,000 50,400 8,025 3,600 3,900 191,925 294,735 S $ $ $ $ $ usuu vil 16,800 $ 2,675$ 1,200 $ 1,300 $ 63,975 $ 97,860 $ 16,800 $ 2,675 $ 1,200 $ 1,300 $ 63,975 $ 97,830 $ 16,800 $ 2,675 $ 1,200 $ 1,300 $ 63,975 S 99,045 $ 50,400 8,025 3,600 3,900 191,925 294,735 $ $ $ 97,860S 22,590 $ 97,830$ 22,590 $ 99,045 $ 22,590S $ 294,735 68,540 74 Depreciation 75 Property Taxes 76 Insurance 77 Maintenance 78 Fixed manufacturing overhead 79 Total Fixed Cost 80 81 Total manufacturing overhead 82 Direct labor hours 83 Predetermined overhead rate for the quarter 84 85 86 87 88 89 90 Budget sales in units 91 Variable expenses per unit 92 Total Variable selling and admin expenses 93 Fixed expenses 94 Advertising 95 Insurance 96 Salaries 97 Depreciation 98 Others 99 Total Fixed Expenses 100 Total S&A expenses 101 102 103 104 Accounts Receivable, 12/31/13 105 January Sales 106 February Sales Waterway Corporation Selling and Administrative Expense Budget For the First Quarter of 20xx First Quarter January February $ 113,000 $ 112,500 $ $ 1.60 $ 1.60 $ $ 180,800 $ 180,000 $ March 116,000 $ 1.60 $ 185,600 $ Quarter 341,500 1.60 546,400 $ $ $ $ $ $ $ 15,000 $ 1,400 $ 72,000 $ 2,500 $ 3,000 $ 93,900 $ 274,700 $ 15,000 $ 1,400 5 72,000 $ 2,500 $ 3,000 $ 93,900 $ 273,900 $ 15,000 $ 1,400 $ 72,000 $ 2,500 $ 3,000 $ 93,900 $ 279,500 $ 45,000 4,200 216,000 7,500 9,000 281,700 828,100 March Schedule of Expected Collections from Customers January February $ 183,780 formula Formula Formula
Step by Step Solution
There are 3 Steps involved in it

Get step-by-step solutions from verified subject matter experts