

Question: I need help with MATLAB code ASAP. i want to select and extract features from the training data shown in the given graphs. Looking at
I need help with MATLAB code ASAP.
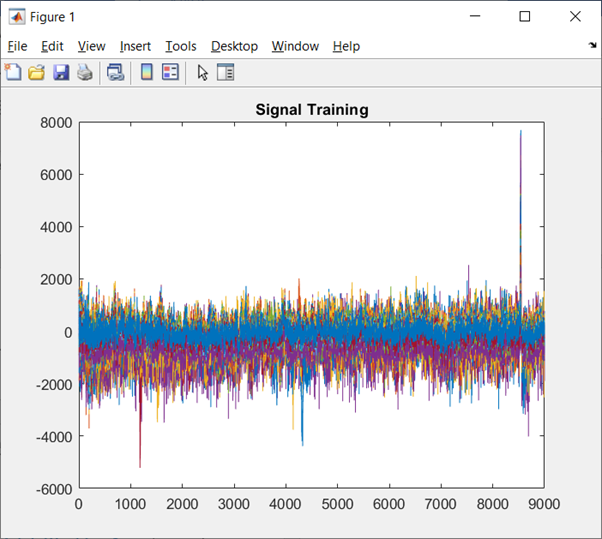
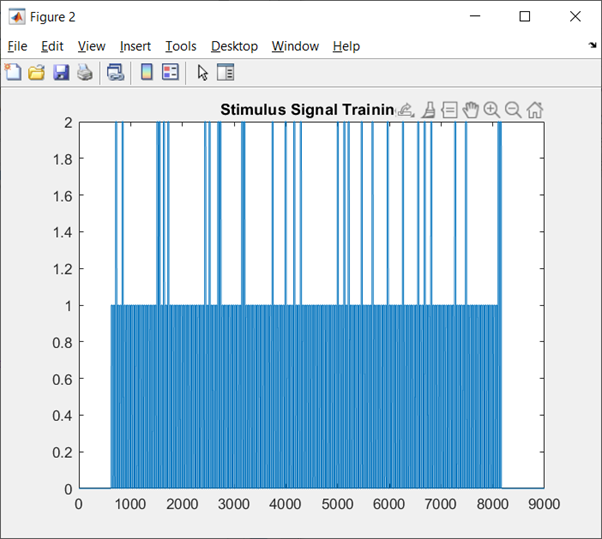
i want to select and extract features from the training data shown in the given graphs. Looking at the differences between the stimulus and non-stimulus trials I want to select four features to be used for classification and perform a feature ranking methodology (e.g. Fishers score, or corrcoeff) to prune features that are less informative or keep just few features that are not highly correlated. Can you write a MATLAB code for this. thanks
Figure 1 Eile Edit View Insert Tools Desktop Window Help 2 Signal Training 8000 6000 4000 2000 0 -2000 -4000 -6000 0 1000 2000 3000 4000 5000 6000 7000 8000 9000 Figure 2 Eile Edit View Insert Tools Desktop Window Help 2 Stimulus Signal Trainin. A 2 2 1.8 1.6 1.4 1.2 1 0.8 0.6 0.4 0.2 0 1000 2000 3000 4000 5000 6000 7000 8000 9000 Figure 1 Eile Edit View Insert Tools Desktop Window Help 2 Signal Training 8000 6000 4000 2000 0 -2000 -4000 -6000 0 1000 2000 3000 4000 5000 6000 7000 8000 9000 Figure 2 Eile Edit View Insert Tools Desktop Window Help 2 Stimulus Signal Trainin. A 2 2 1.8 1.6 1.4 1.2 1 0.8 0.6 0.4 0.2 0 1000 2000 3000 4000 5000 6000 7000 8000 9000
Step by Step Solution
There are 3 Steps involved in it

Get step-by-step solutions from verified subject matter experts