

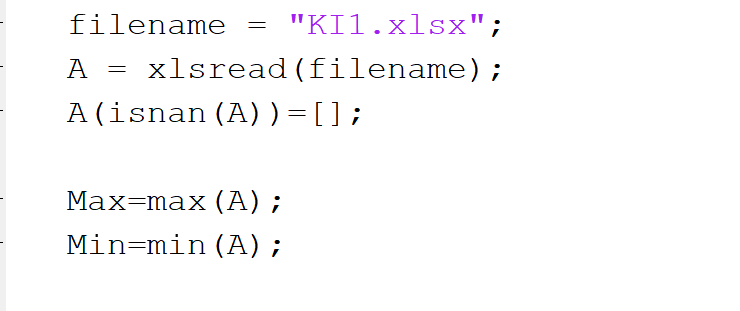
Question: I need help with matlab code to complete the following below. The first picture is the code I have now that reads the file and
I need help with matlab code to complete the following below. The first picture is the code I have now that reads the file and find the min and max values. I need help with code that will do the following in the second picture.
here is the spreadsheet: https://1drv.ms/x/s!Aj0EGBNy0RCLjWL2fZ1yabMrx3_s
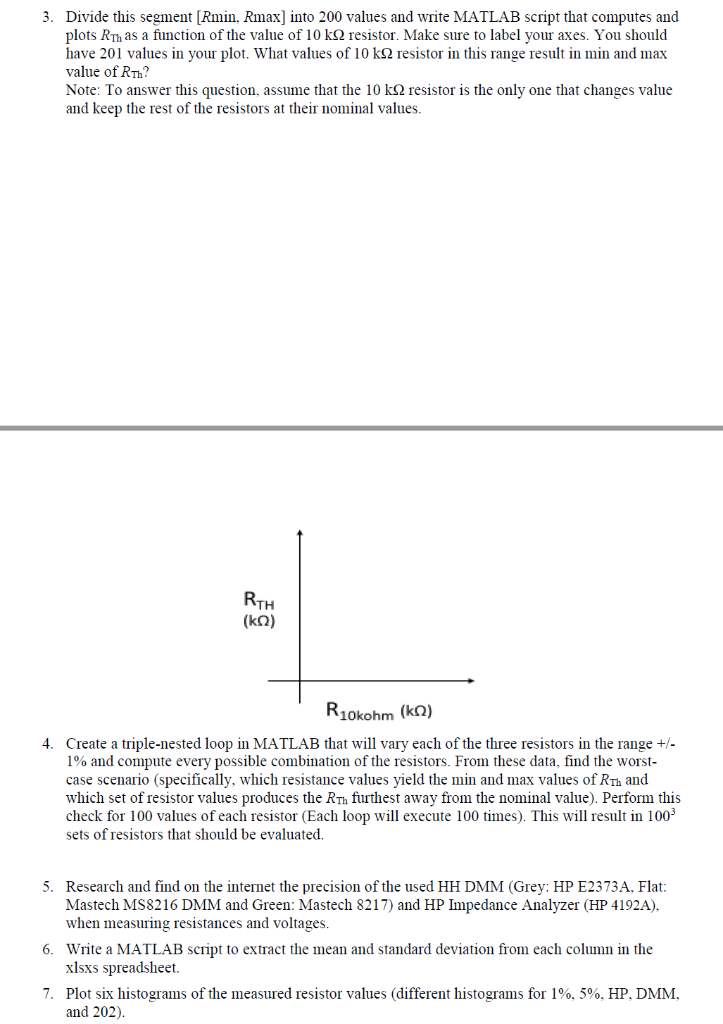
filename-"KI1.xlsx"; A - xlsread (Eilename) A(isnan (A) ) ]; Max-max (A) ; Min-min (A) ; 3. Divide this segment [Rmin, Rmax] into 200 values and write MATLAB script that computes and plots RTh as a function of the value of 10 k resistor. Make sure to label your axes. You should have 201 values in your plot. What values of 10 k resistor in this range result in min and max value of RTh? Note: To answer this question, assume that the 10 k resistor is the only one that changes value and keep the rest of the resistors at their nominal values TH (k2) R10kohm (ko) 4. Create a triple-nested loop in MATLAB that will vary each of the three resistors in the range/ 190 and compute every possible combination of the resistors. From these data, find the worst- case scenario (specifically, which resistance values yield the min and max values of RTh and which set of resistor values produces the RTh furthest away from the nominal value). Perform this check for 100 values of each resistor (Each loop will execute 100 times). This will result in 1005 sets of resistors that should be evaluated. 5. Research and find on the internet the precision of the used HH DMM (Grey: HP E2373A, Flat Mastech MS8216 DMM and Green: Mastech 8217) and HP Impedance Analyzer (HP 4192A). when measuring resistances and voltages. 6. Write a MATLAB script to extract the mean and standard deviation from each colum the xlsxs spreadsheet 7. Piot six histograms of the measured resistor values (different histograms for 1%, 5%. HP, DMM and 202) filename-"KI1.xlsx"; A - xlsread (Eilename) A(isnan (A) ) ]; Max-max (A) ; Min-min (A) ; 3. Divide this segment [Rmin, Rmax] into 200 values and write MATLAB script that computes and plots RTh as a function of the value of 10 k resistor. Make sure to label your axes. You should have 201 values in your plot. What values of 10 k resistor in this range result in min and max value of RTh? Note: To answer this question, assume that the 10 k resistor is the only one that changes value and keep the rest of the resistors at their nominal values TH (k2) R10kohm (ko) 4. Create a triple-nested loop in MATLAB that will vary each of the three resistors in the range/ 190 and compute every possible combination of the resistors. From these data, find the worst- case scenario (specifically, which resistance values yield the min and max values of RTh and which set of resistor values produces the RTh furthest away from the nominal value). Perform this check for 100 values of each resistor (Each loop will execute 100 times). This will result in 1005 sets of resistors that should be evaluated. 5. Research and find on the internet the precision of the used HH DMM (Grey: HP E2373A, Flat Mastech MS8216 DMM and Green: Mastech 8217) and HP Impedance Analyzer (HP 4192A). when measuring resistances and voltages. 6. Write a MATLAB script to extract the mean and standard deviation from each colum the xlsxs spreadsheet 7. Piot six histograms of the measured resistor values (different histograms for 1%, 5%. HP, DMM and 202)
Step by Step Solution
There are 3 Steps involved in it

Get step-by-step solutions from verified subject matter experts