

Question: I need help with MATLAB exercise. Please explain me with the comments. Thank you very much 1. Below you will find a table with hours
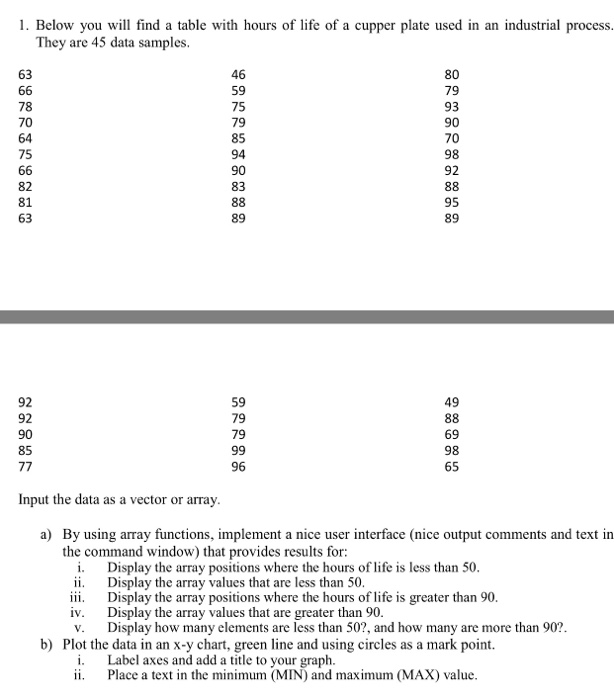
1. Below you will find a table with hours of life of a cupper plate used in an industrial process They arc 46 59 75 79 85 94 90 83 80 79 93 90 70 98 92 63 78 70 64 75 82 81 63 95 89 89 49 92 92 90 85 59 79 79 69 98 65 96 Input the data as a vector or array a) By using array functions, implement a nice user interface (nice output comments and text in the command window) that provides results for: i. Display the array positions where the hours of life is less than 50 ii. Display the array values that are less than 50 iii. Display the array positions where the hours of life is greater than 90 iv. Display the array values that are greater than 90 v. Display how many elements are less than 50?, and how many are more than 90? b) Plot the data in an x-y chart, green line and using circles as a mark point. i. Label axes and add a tle to your graph Place a text in the minimum (MIN) and maximum (MAX) value
Step by Step Solution
There are 3 Steps involved in it

Get step-by-step solutions from verified subject matter experts