

Question: i need help with matlab please help!!!! Homework #5 Applied Programming, ENGR 10573 Spring 2018 Due Monday, Mar. uploaded through TCU Online by 11:59 PM.
 i need help with matlab please help!!!!
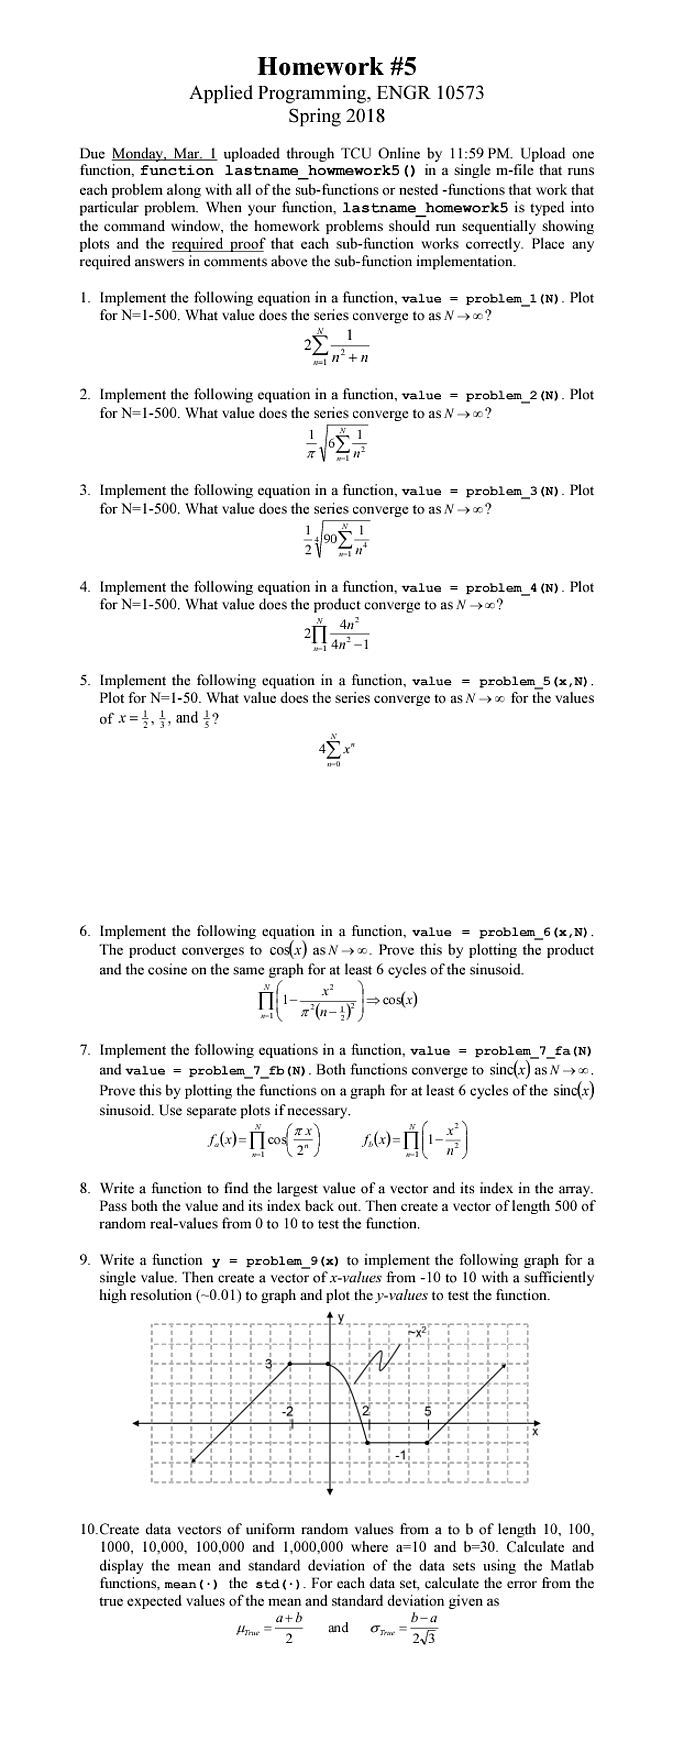
Homework #5 Applied Programming, ENGR 10573 Spring 2018 Due Monday, Mar. uploaded through TCU Online by 11:59 PM. Upload one function, function lastname_howmework5 ) in a single m-file that runs each problem along with all of the sub-functions or nested -functions that work that particular problem. When your function, lastname _homework5 is typed into the command window, the homework problems should run sequentially showing plots and the required proof that each sub-function works correctly. Place any required answers in comments above the sub-function implementation. I. Implement the following equation in a function, value -problem 1 (N). Plot for N-I-500. What value does the series converge to as N-> 0? +n 2. Implement the following equation in a function, value -problem 2 (N). Plot for N=1-500. What value does the series converge to as N->0? 3- Implement the following equation in a function, value = problem-3(N)-Plot for N=1-500. What value does the series converge to as N->c? 4. Implement the following equation in a function, value-problem_ 4 (N). Plot for N=1-500. What value does the product converge to as N 0? 4n 5. Implement the following equation in a function, value -problem 5 (x, N) Plot for N-1-50. What value does the series converge to as N-> oo for the values 6. Implement the following equation in a function, value - problem 6 (x,N) The product converges to cos(x) as Nx. Prove this by plotting the product and the cosine on the same graph for at least 6 cycles of the sinusoid. .t 7. Implement the following equations in a function, value - problem 7 fa (N) and value-problem-7_fb (N). Both functions converge to sinc(x) as N oo Prove this by plotting the functions on a graph for at least 6 cycles of the sincx sinusoid. Use separate plots if necessary 2" 8. Write a function to find the largest value of a vector and its index in the array Pass both the value and its index back out. Then create a vector of length 500 of random real-values from 0 to 10 to test the functionn 9. Write a function y = problem-9(x) to implement the following graph for a single value. Then create a vector of x-values from -10 to 10 with a sufficiently high resolution (0.01) to graph and plot the y-values to test the function. 10.Create data vectors of unifom random values from a to b of length 10, 100 1000, 10.000, 100,000 and 1,000,000 where a-10 and b-30. Calculate and display the mean and standard deviation of the data sets using the Matlab functions, mean the std (. For each data set, calculate the error from the true expected values of the mean and standard deviation given as a+b
Step by Step Solution
There are 3 Steps involved in it

Get step-by-step solutions from verified subject matter experts