

Question: I need help with number #6 r Task elow are some fictitious data consistent with the findings of Nisbett and Wilson. For the sake of
I need help with number #6
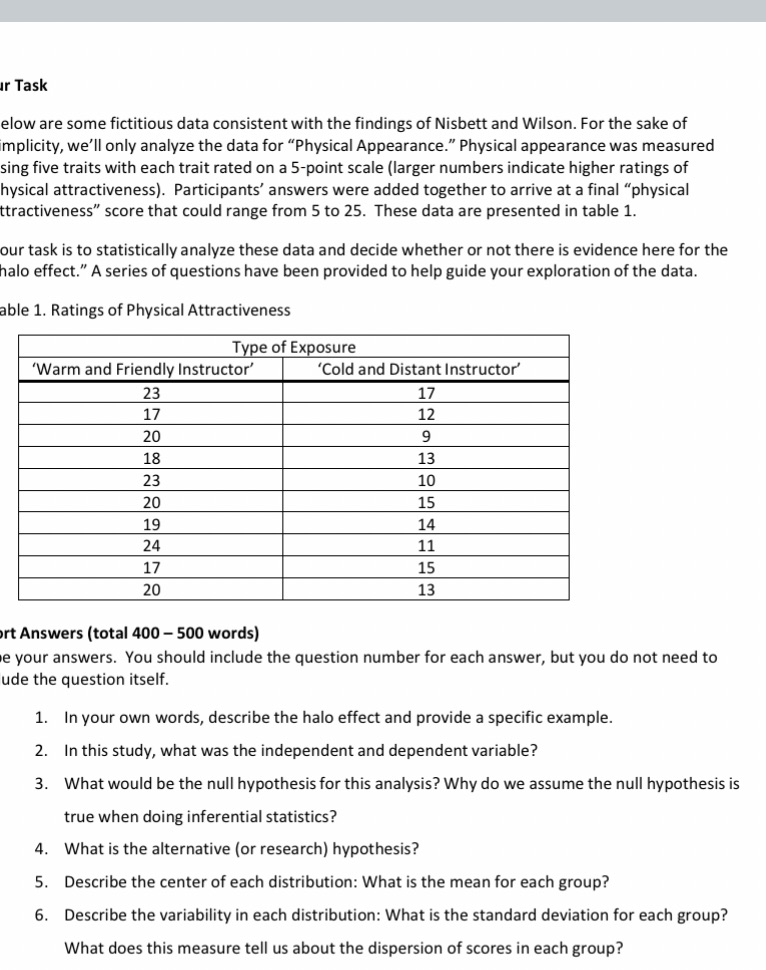
r Task elow are some fictitious data consistent with the findings of Nisbett and Wilson. For the sake of mplicity, we'll only analyze the data for "Physical Appearance." Physical appearance was measured sing five traits with each trait rated on a 5-point scale (larger numbers indicate higher ratings of hysical attractiveness). Participants' answers were added together to arrive at a final "physical tractiveness" score that could range from 5 to 25. These data are presented in table 1. our task is to statistically analyze these data and decide whether or not there is evidence here for the halo effect." A series of questions have been provided to help guide your exploration of the data. able 1. Ratings of Physical Attractiveness Type of Exposure 'Warm and Friendly Instructor' Cold and Distant Instructor' 23 17 17 12 20 9 18 13 23 10 20 15 19 14 24 11 17 15 20 13 rt Answers (total 400 - 500 words) e your answers. You should include the question number for each answer, but you do not need to ude the question itself. 1. In your own words, describe the halo effect and provide a specific example. 2. In this study, what was the independent and dependent variable? 3. What would be the null hypothesis for this analysis? Why do we assume the null hypothesis is true when doing inferential statistics? 4. What is the alternative (or research) hypothesis? 5. Describe the center of each distribution: What is the mean for each group? 6. Describe the variability in each distribution: What is the standard deviation for each group? What does this measure tell us about the dispersion of scores in each group
Step by Step Solution
There are 3 Steps involved in it

Get step-by-step solutions from verified subject matter experts