

Question: i need help with part 3. For part 3 to be answered the information has to be gotten from 1 and 2. I gave the
i need help with part 3. For part 3 to be answered the information has to be gotten from 1 and 2. I gave the answers to part 1.
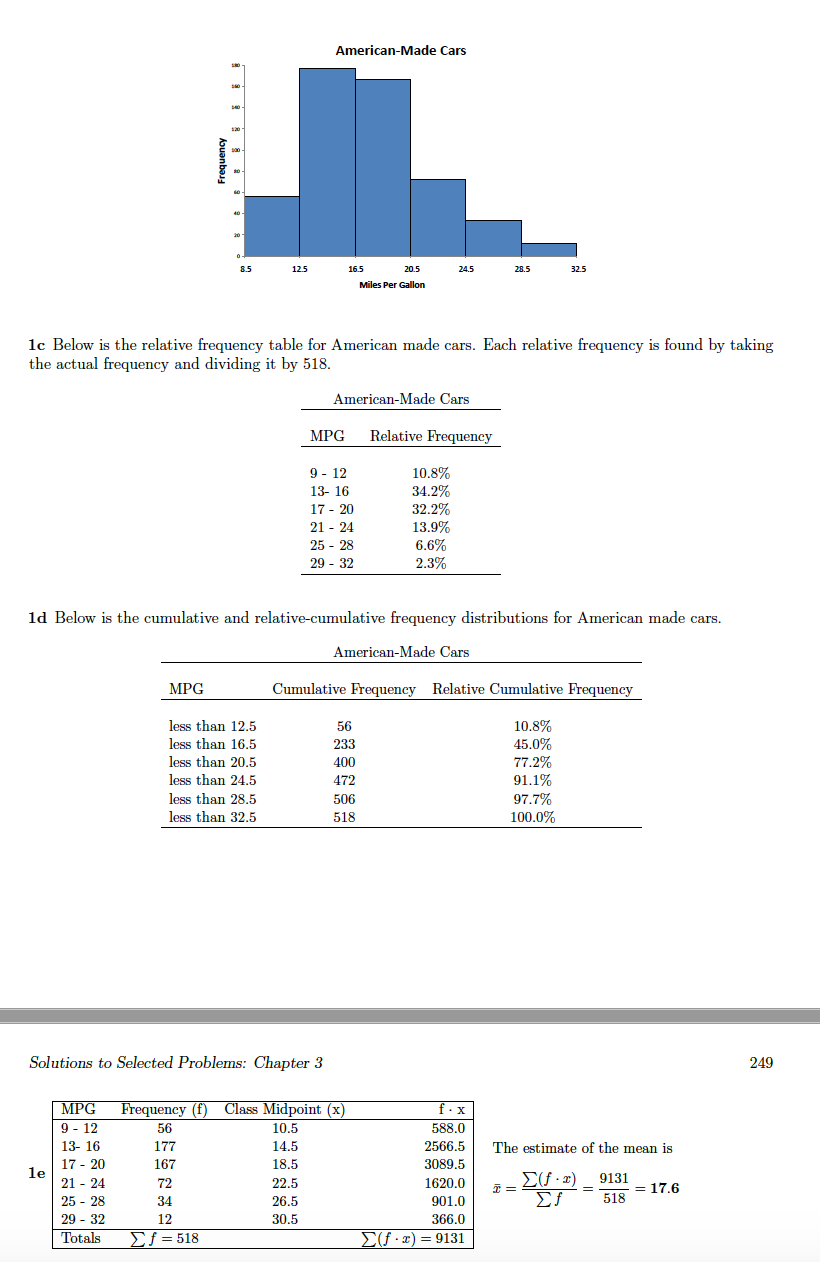
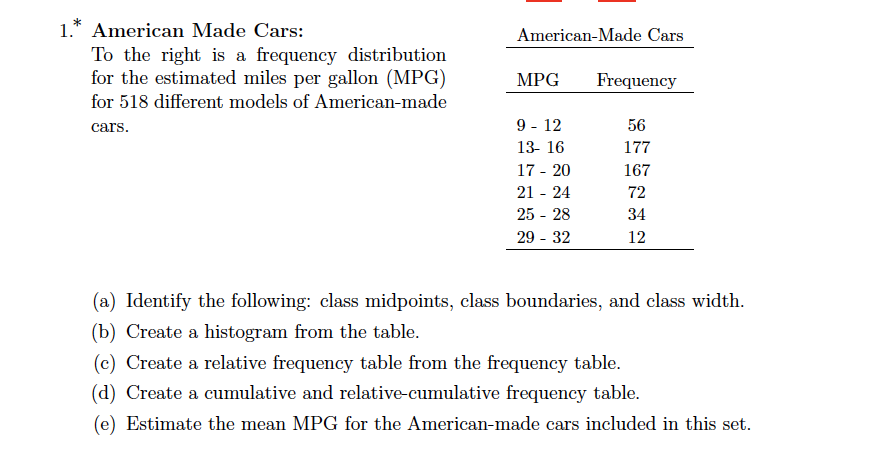
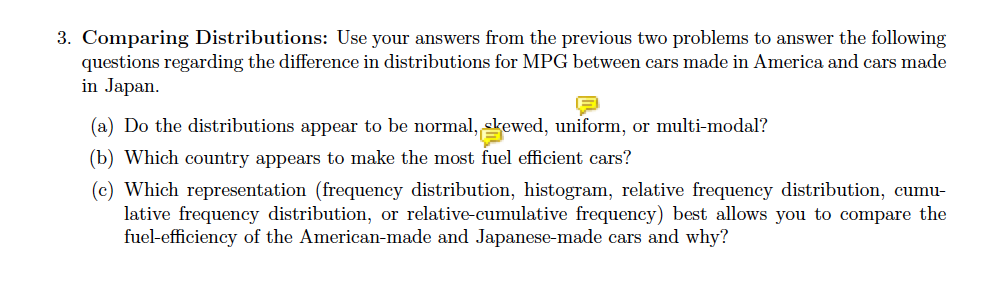
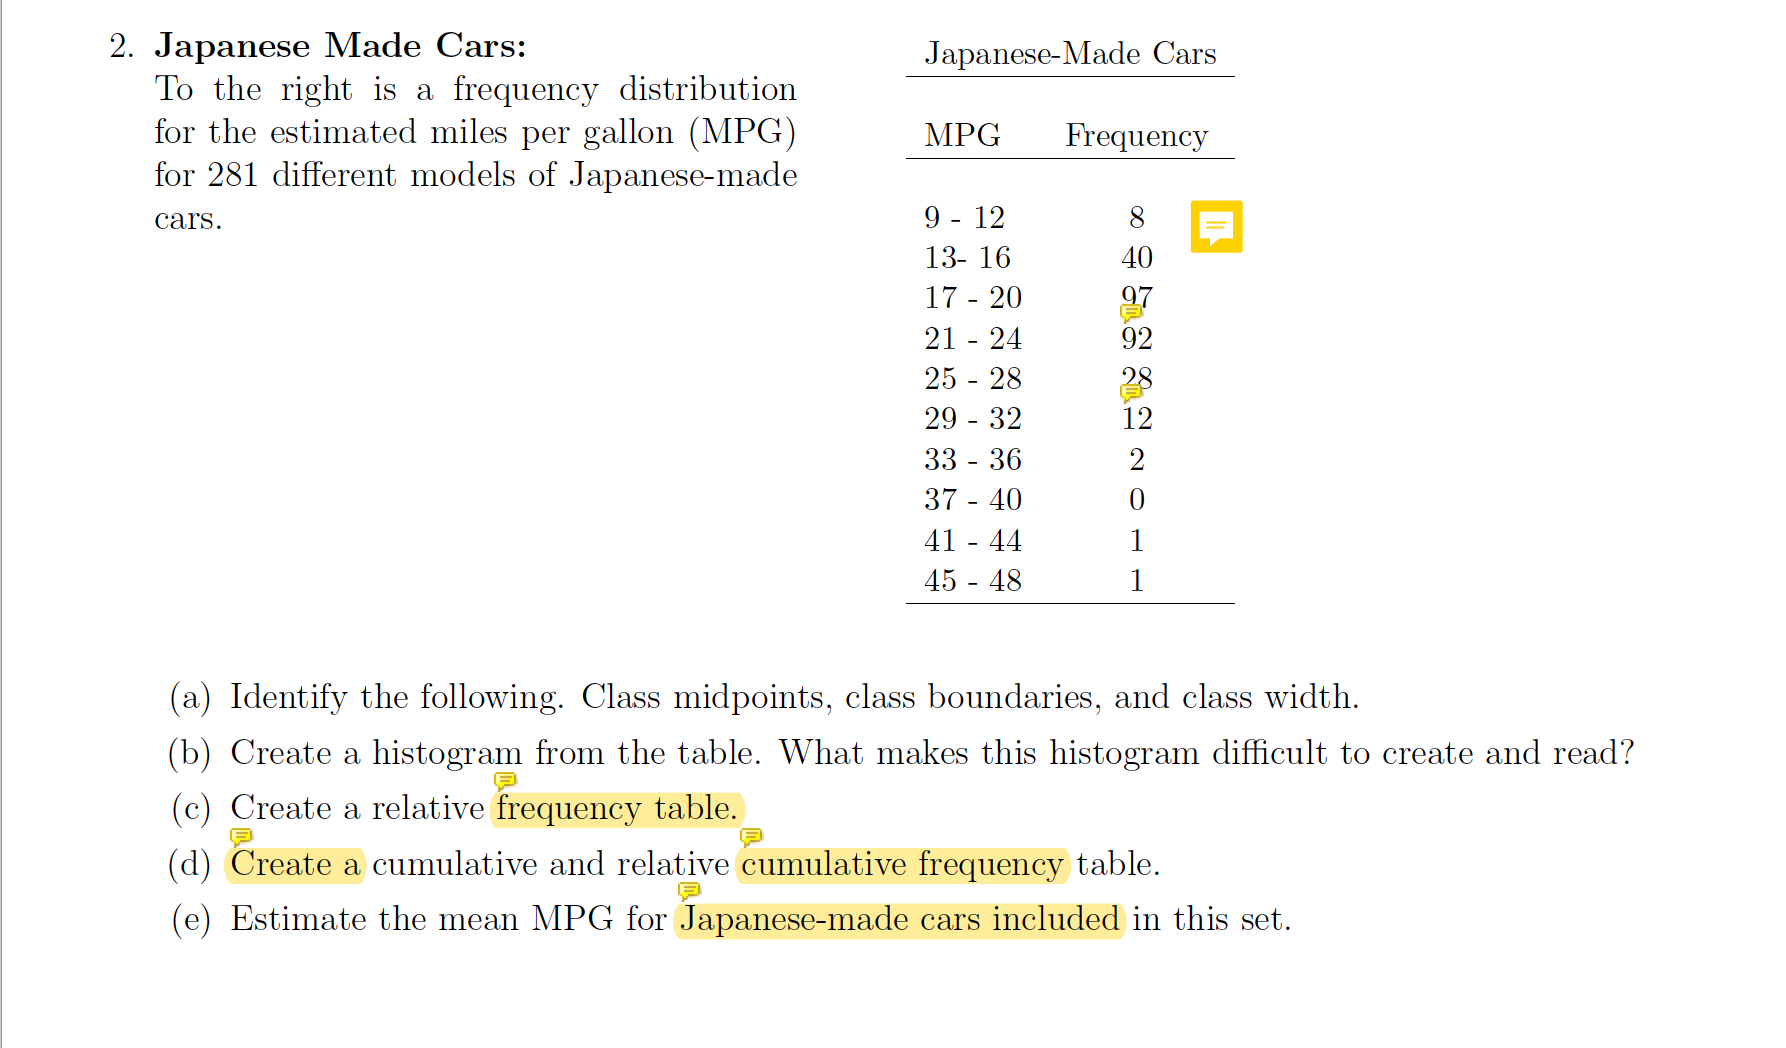
ArnecanMade Cars 1c Below is the relative frequency table for American made cars. Each relative frequent}.r is found by taking the actual frequency and. dividing it by 513. AmericanMade Cars MPG Relative Frequency 9 - 12 10.3% 13 16 34.2% 17 2|] 32.2% 21 24 13.9% 25 28 0.6% 29 32 2.3% 1d Below is the cumulative and relativecumulative frequency distributions for American made cars. AmericanMade Cars MPG Cumulative Fiequency Relative Cumulative Frequency less than 12.5 56 10.8% less than 16.5 233 450% less than 20.5 400 712% less than 24.5 472 91.1% less than 23.5 506 917% less than 32.5 518 100.0% Solutions to Selected Problems: Chapter 3 249 MPG Ftequecncy (f) Clam Midpoint (x) f . x 9 12 55 10.5 530.0 13 16 127 121.5 2500.5 The mm of the m is 1e 17 20 107 10.5 3000.5 21 24 72 22.5 1020.0 5: = Elf'I) = E = 17.0 25 23 34 20.5 001.0 E f 518 20 32 12 30.5 300.0 'Ibtals E f = 513 EU 5} = 9131 1.* American Made Cars: AmericanMade Cars To the right is a frequency distribution for the estimated miles per gallon (MPG) MPG Frequency for 518 djerent models of Americanmade cars. 9 12 56 13 16 177 17 20 167 21 24 72 25 28 34 29 32 12 (a) Identify the following: class midpoints, class boundaries, and class width. (b) Create a histogram from the table. (c) Create a relative frequency table from the frequency table. ((1) Create a cumulative and relativecumulative frequency table. (e) Estimate the mean MPG for the Americanmade cars included in this set. 3. Comparing Distributions: Use your answers from the previous two problems to answer the following questions regarding the difference in distributions for MPG between cars made in America and cars made in Japan. (a) Do the distributions appear to be normal, skewed, uniform, or multi-modal? (b) Which country appears to make the most fuel efficient cars? (c) Which representation (frequency distribution, histogram, relative frequency distribution, cumu- lative frequency distribution, or relative-cumulative frequency) best allows you to compare the fuel-efficiency of the American-made and Japanese-made cars and why?2. Japanese Made Cars: Japanese-Made Cars To the right is a frequency distribution for the estimated miles per gallon (MPG) MPG Frequency for 281 different models of Japanese-made cars. 9 - 12 8 = 13- 16 40 17 - 20 97 21 - 24 92 25 - 28 28 F 29 - 32 12 33 - 36 37 - 40 HHON 41 - 44 45 - 48 (a) Identify the following. Class midpoints, class boundaries, and class width. (b) Create a histogram from the table. What makes this histogram difficult to create and read? (c) Create a relative frequency table. F P (d) Create a cumulative and relative cumulative frequency table. (e) Estimate the mean MPG for Japanese-made cars included in this set
Step by Step Solution
There are 3 Steps involved in it

Get step-by-step solutions from verified subject matter experts