

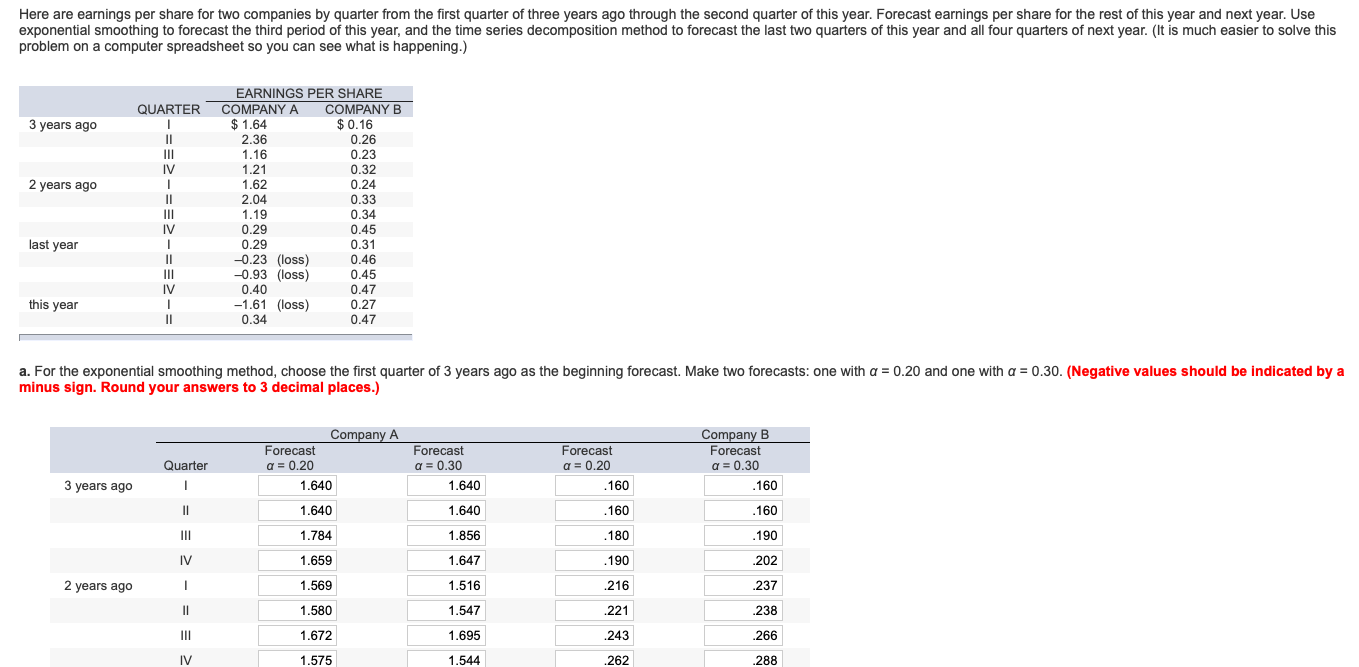
Question: I need help with part C please. Here are earnings per share for two companies by quarter from the first quarter of three years ago
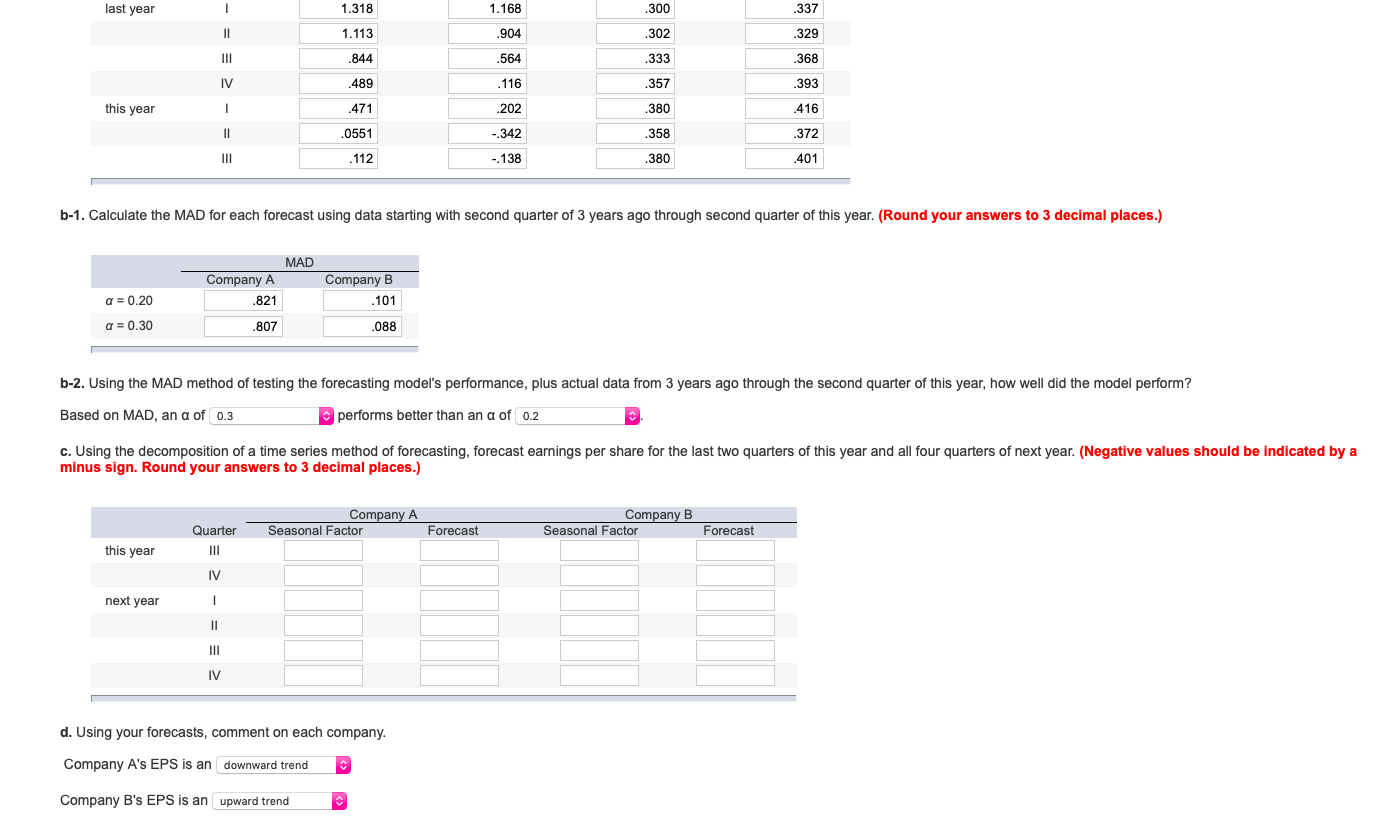
I need help with part C please.
Step by Step Solution
There are 3 Steps involved in it
1 Expert Approved Answer
Step: 1 Unlock

Question Has Been Solved by an Expert!
Get step-by-step solutions from verified subject matter experts
Step: 2 Unlock
Step: 3 Unlock