Question: I need help with projecting income statement, balance sheet and Cash flows. See attache Current assets: Cash and cash equivalents Marketable securities Inventories Accounts receivable,
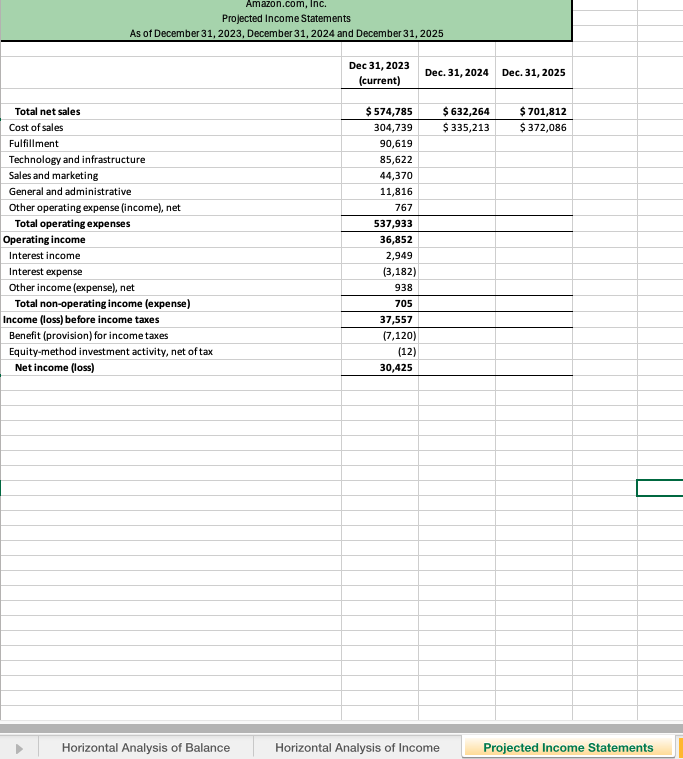
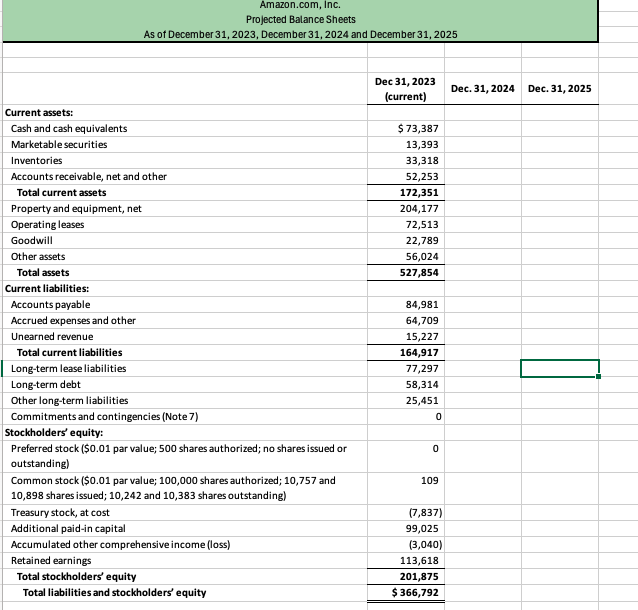
I need help with projecting income statement, balance sheet and Cash flows. See attache
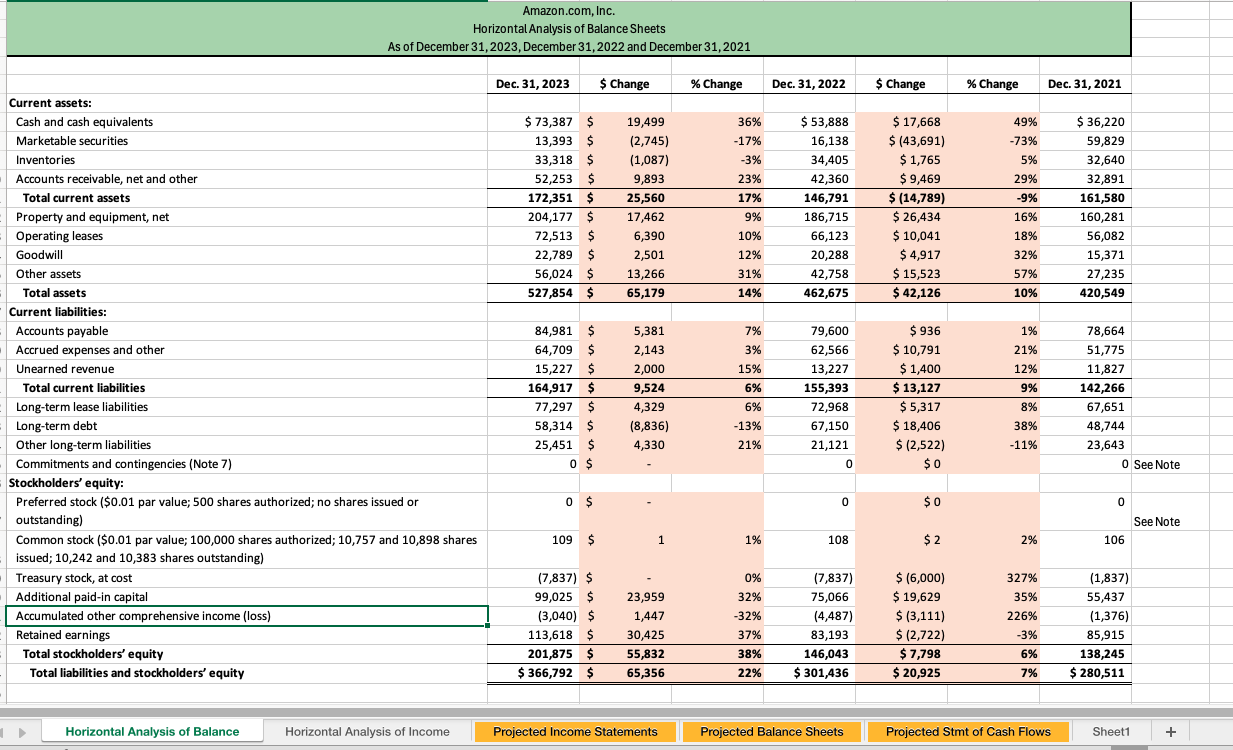
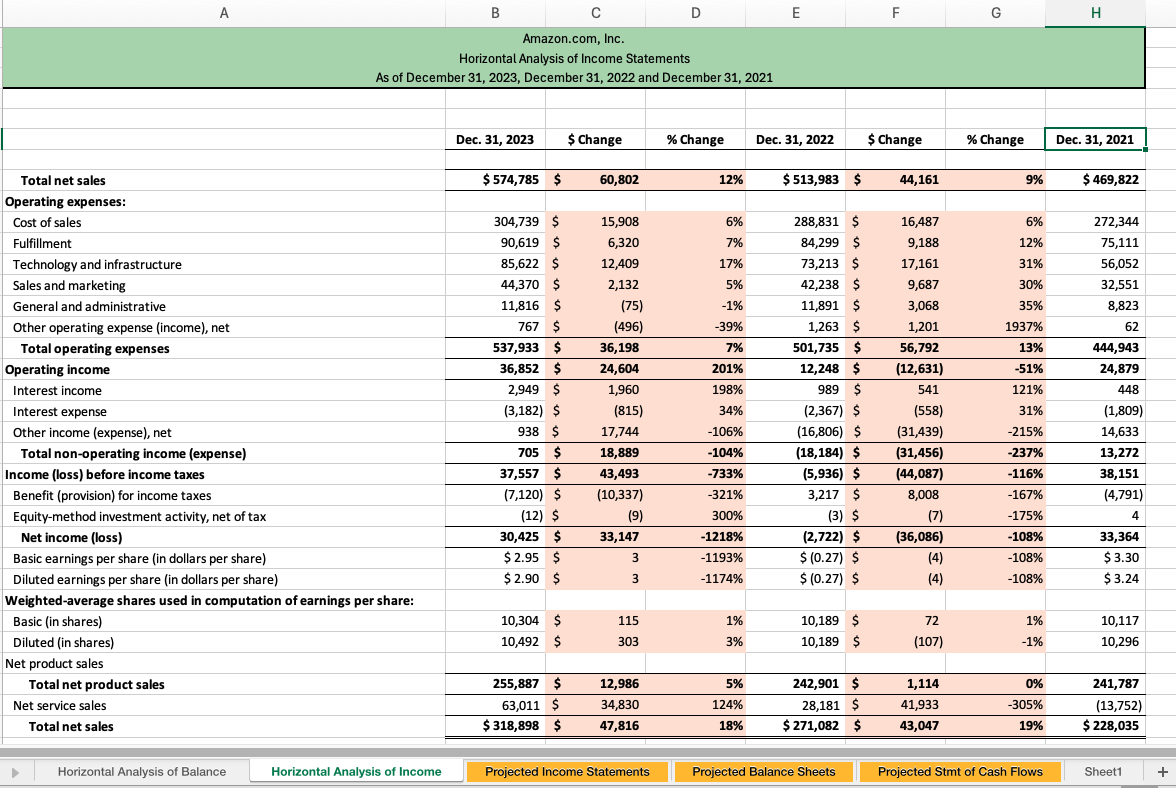
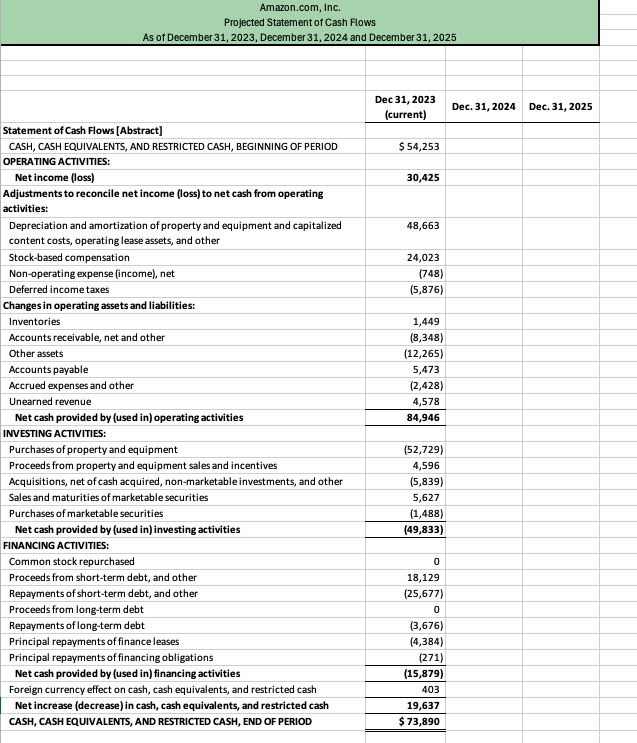
Current assets: Cash and cash equivalents Marketable securities Inventories Accounts receivable, net and other Total current assets Property and equipment, net Operating leases Goodwill Other assets Total assets ' Current liabilities: Accounts payable Accrued expenses and other Unearned revenue Total current liabilities Long-term lease liabilities Long-term debt Other long-term liabilities Commitments and contingencies (Mote 7) | | Stockholders' equity: Preferred stock ($0.01 par value; 500 shares authorized; no shares issued or outstanding) Common stock ($0.01 par value; 100,000 shares authorized; 10,757 and 10,898 shares issued; 10,242 and 10,383 shares outstanding) Treasury stock, at cost Additional paid-in capital Accumulated other comprehensive income (loss) Retained earnings Total stockholders' equity Total liabilities and stockholders' equity Herizontal Analysis of Balance Horizontal Analysis of Income Amazon.com, Inc. Horizontal Analysis of Balance Sheets As of December 31,2023, December 31,2022 and December 31,2021 Dec. 31,2023 S Change % Change Dec. 31,2022 % Change % Change Dec. 31,2021 573,387 5 19,499 36% 553,888 517,668 49% $ 36,220 13,393 5 (2,745) -17% 16,138 S (43,691) -73% 59,829 33,318 5 (1,087) -3% 34,405 $ 1,765 5% 32,640 52,253 S 9,893 23% 42,360 59,469 29% 32,891 172,351 25,560 17% 146,791 $ (14,789) -9% 161,580 204,177 S 17,462 9% 186,715 $26434 16% 160,281 72,513 & 6,390 10% 66,123 510,041 18% 56,082 22,789 S 2,501 12% 20,288 $ 4917 32% 15,371 56,024 5 13,266 31% 42,758 $15,523 57% 27,235 527,854 & 65,179 14% 462,675 $42,126 10% 420,549 84,981 S 5,381 7% 79,600 $936 1% 78,664 64,709 S 2,143 3% 62,566 510,791 21% 51,775 15,227 S 2,000 15% 13,227 $ 1,400 12% 11,827 164,917 $ 9,524 6% 155,393 $13,127 9% 142,266 77,297 s 4,329 6% 72,968 $5,317 8% 67,651 58,314 5 (8,836) -13% 67,150 518,406 38% 48,744 25451 5 4,330 21% 21,121 5(2,522) -11% 23,643 0s - 0 S0 o [ - 0 50 0 109 s 1 1% 108 52 2% 106 (7,837) & - 0% (7,837) $ (6,000) 327% (1,837) 99,025 $ 23,959 32% 75,066 $19,629 35% 55,437 (3,040) & 1,847 -32% (4,487) 5(3,111) 226% (1,376) 113,618 S 30,425 37% 83,193 S$(2,722) -3% 85,915 201,875 55,832 38% 146,043 $7,798 6% 138,245 $366,792 65,356 22% $301,436 520,925 7% $280,511 Projected Income Statements Projected Balance Sheets Projected Stmt of Cash Flows Sheet1 SeeNote SeeNote A B c D E B G H Amazon.com, Inc. Horizontal Analysis of Income Statements As of December 31, 2023, December 31, 2022 and December 31, 2021 Dec. 31, 2023 Change % Change Dec. 31, 2022 % Change % Change | Dec. 31, 2021 .l Total net sales $574,785 60,802 12% $513,983 44,161 9% $469,822 Operating expenses: Cost of sales 304,739 S 15,908 6% 288,831 S 16,487 6% 272,344 Fulfillment 90,619 S 6,320 % 84299 S 9,188 12% 75,111 Technology and infrastructure 85,622 S 12,409 17% 73213 S 17,161 31% 56,052 Sales and marketing 44370 5 2,132 5% 42,238 5 9,687 30% 32,551 General and administrative 11,816 S (75) -1% 11,891 S 3,068 35% 8,823 Other operating expense (income), net 767 S (496) -39% 1,263 S 1,201 1937% 62 Total operating expenses 537,933 36,198 7% 501,735 56,792 13% 444,943 Operating income 36,852 $ 24,604 201% 12,248 $ (12,631) -51% 24,879 Interest income 2949 S 1,960 198% 989 S 541 121% 448 Interest expense (3,182) S (815) 34% (2,367) S (558) 31% (1,809) Other income (expense), net 938 S 17,744 -106% (16,806) S (31,439) -215% 14,633 Total non-operating income (expense) 705 $ 18,889 -104% (18,184) $ (31,456) -237% 13,272 Income (loss) before income taxes 37,557 43,493 -733% (5,936) $ (44,087) -116% 38,151 Benefit (provision) for income taxes (7,120) S (10,337} -321% 3217 8,008 -167% (4,791) Equity-method investment activity, net of tax (12) $ 9) 300% (3) (7) -175% 4 Net income (loss) 30,425 33,147 -1218% 2722) $ (36,086) -108% 33,364 Basic earnings per share (in dollars per share) $2.95 S 3 -1193% 5(0.27) 5 (4) -108% $3.30 Diluted earnings per share (in dollars per share) $2.90 S 3 -1174% $(0.27) S (4) -108% $3.24 Weighted-average shares used in computation of earnings per share: Basic (in shares) 10304 5 115 1% 10,189 S 72 1% 10,117 Diluted (in shares) 10492 S 303 3% 10,189 S (107) -1% 10,296 Net product sales Total net product sales 255,887 S 12,986 5% 242,901 $ 1,114 0% 241,787 Net service sales 63,011 S 34,830 124% 28181 S 41,933 -305% (13,752) Total net sales $318,898 $ 47,816 18% $271,082 43,047 19% $228,035 Horizontal Analysis of Balance Horizontal Analysis of Income Projected Income Statements Projected Balance Sheets Projected Stmt of Cash Flows Sheet1 + Projected Income Statements As of December 31, 2023, December 31, 2024 and December 31, 2025 Dec 31, 2023 Dec. 31, 2024 Dec. 31, 2025 (current) Total net sales $ 574,785 $ 632,264 $ 701,812 Cost of sales 304,739 $335,213 $ 372,086 Fulfillment 90,619 Technology and infrastructure 85,622 Sales and marketing 44,370 General and administrative 11,816 Other operating expense (income), net 767 Total operating expenses 537,933 Operating income 36,852 Interest income 2,949 Interest expense (3,182) Other income (expense), net 938 Total non-operating income (expense) 705 Income (loss) before income taxes 37,557 Benefit (provision) for income taxes (7,120) Equity-method investment activity, net of tax (12] Net income (loss) 30,425 Horizontal Analysis of Balance Horizontal Analysis of Income Projected Income StatementsAmazon.com, Inc. Projected Balance Sheets As of December 31, 2023, December 31, 2024 and December 31, 2025 Current assets: Cach and cash equivalents Marketable securities Inventories Accounts receivable, net and other Total current assets Property and equipment, net Operating leases Goodwill Other assets Total assets Current liabilities: Accounts payable Accrued expenses and other Unearned revenue Total current liabilities Long-term lease liabilities Long-term debt Other long-term liabilities Commitments and contingencies (Note 7} Stockholders' equity: Preferred stock ($0.01 par value; 500 shares authorized; no shares issued or outstanding) Common stock (50.01 par value; 100,000 shares authorized; 10,757 and 10,898 shares issued; 10,242 and 10,383 shares outstanding) Treasury stock, at cost Additional paid-in capital Accumulated other comprehensive income [loss) Retained earnings Total stockholders' equity Total liabilities and stockholders' equity Dec 31, 2023 {current) 73,387 13,393 33,318 52,253 172,351 204,177 72,513 22,789 56,024 527,854 84,981 64,709 15,227 164,917 77,297 58,314 25,451 0 109 (7,837) 99,025 (3,040) 113,618 201,875 % 366,792 Dec. 31, 2024 Dec. 31, 2025 Amazon.com, Inc. Projected Statement of Cash Flows As of December 31, 2023, December31, 2024 and December 31, 2025 Statement of Cash Flows [ Abstract] CASH, CASH EQUIVALENTS, AND RESTRICTED CASH, BEGINNING OF PERIOD OPERATING ACTIVITIES: MNet income (loss) Adjustments to recaoncile net income (loss) to net cash from operating activities: Depreciation and amartization of property and equipment and capitalized content costs, operating lease assets, and other Stock-based compensation Mon-operating expense (income), net Deferred income taxes Changes in operating assets and liabilities: Inwventaries Accounts receivable, net and other Other assets Accounts payahble Accrued expenses and other Unearned revenue Met cash provided by [used in) operating activities INVESTING ACTIVITIES: Purchases of property and equipment Proceeds from property and equipment sales and incentives Acquisitions, net of cash acquired, non-marketable investments, and other Sales and maturities of marketable securities Purchases of marketable securities Met cash provided by [used in)investing activities FINANCING ACTIVITIES: Common stock repurchased Proceeds from short-term debt, and other Repayments of short-term debt, and other Proceeds from long-term debt Repayments of long-term debt Principal repayments of finance leases Principal repayments of financing obligations Met cash provided by [used in) financing activities Foreign currency effect on cash, cash equivalents, and restricted cash Met increase (decrease ) in cash, cash equivalents, and restricted cash CASH, CASH EQUIVALENTS, AND RESTRICTED CASH, END OF PERIOD Dec 31, 2023 (current) $ 54,253 30,425 48,663 24,023 (748) (5,876) 1,449 (B,348) (12,265) 5,473 (2,428) 4,578 84,946 (52,729) 4,596 (5,839) 5,627 (1,488) (43,833) 0 18,129 (25,677) 0 (3,676) (4,384) (271) (15,879) 403 19,637 $73,890 Dec. 31, 2024 Dec. 31, 2025
Step by Step Solution
There are 3 Steps involved in it
1 Expert Approved Answer
Step: 1 Unlock
Question Has Been Solved by an Expert!
Get step-by-step solutions from verified subject matter experts
Step: 2 Unlock
Step: 3 Unlock
Students Have Also Explored These Related Accounting Questions!