

Question: I need help with question 1-3 9 0 9 Figure 1. Dataset 1. (15 points) Please illustrate the k-means algorithm on the dataset in Figure
I need help with question 1-3 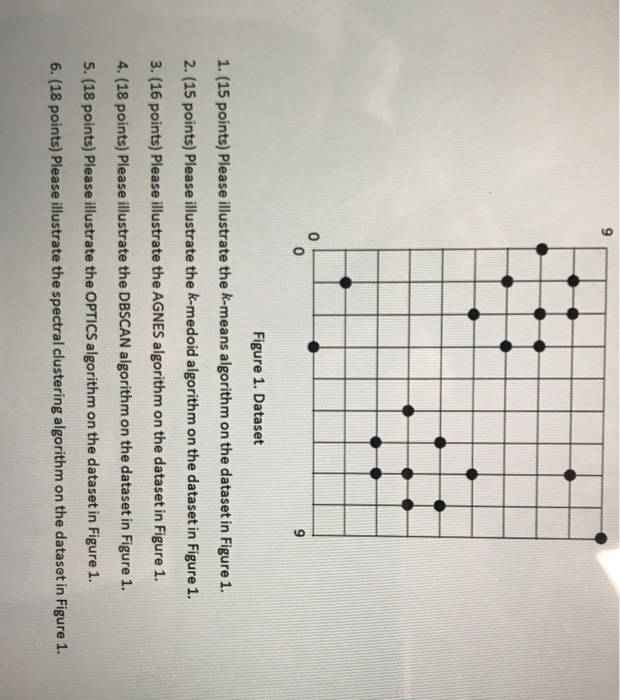
9 0 9 Figure 1. Dataset 1. (15 points) Please illustrate the k-means algorithm on the dataset in Figure 1. 2. (15 points) Please illustrate the k-medoid algorithm on the dataset in Figure 1 3. (16 points) Please illustrate the AGNES algorithm on the dataset in Figure 1. 4. (18 points) Please illustrate the DBSCAN algorithm on the dataset in Figure 1. 5. (18 points) Please illustrate the OPTICS algorithm on the dataset in Figure 1. 6. (18 points) Please illustrate the spectral clustering algorithm on the dataset in Figure 1
Step by Step Solution
There are 3 Steps involved in it
1 Expert Approved Answer
Step: 1 Unlock

Question Has Been Solved by an Expert!
Get step-by-step solutions from verified subject matter experts
Step: 2 Unlock
Step: 3 Unlock