

Question: I need help with question 21 Question 21 9 p The data set below shows a sample of the ages of cars (in years) for
I need help with question 21
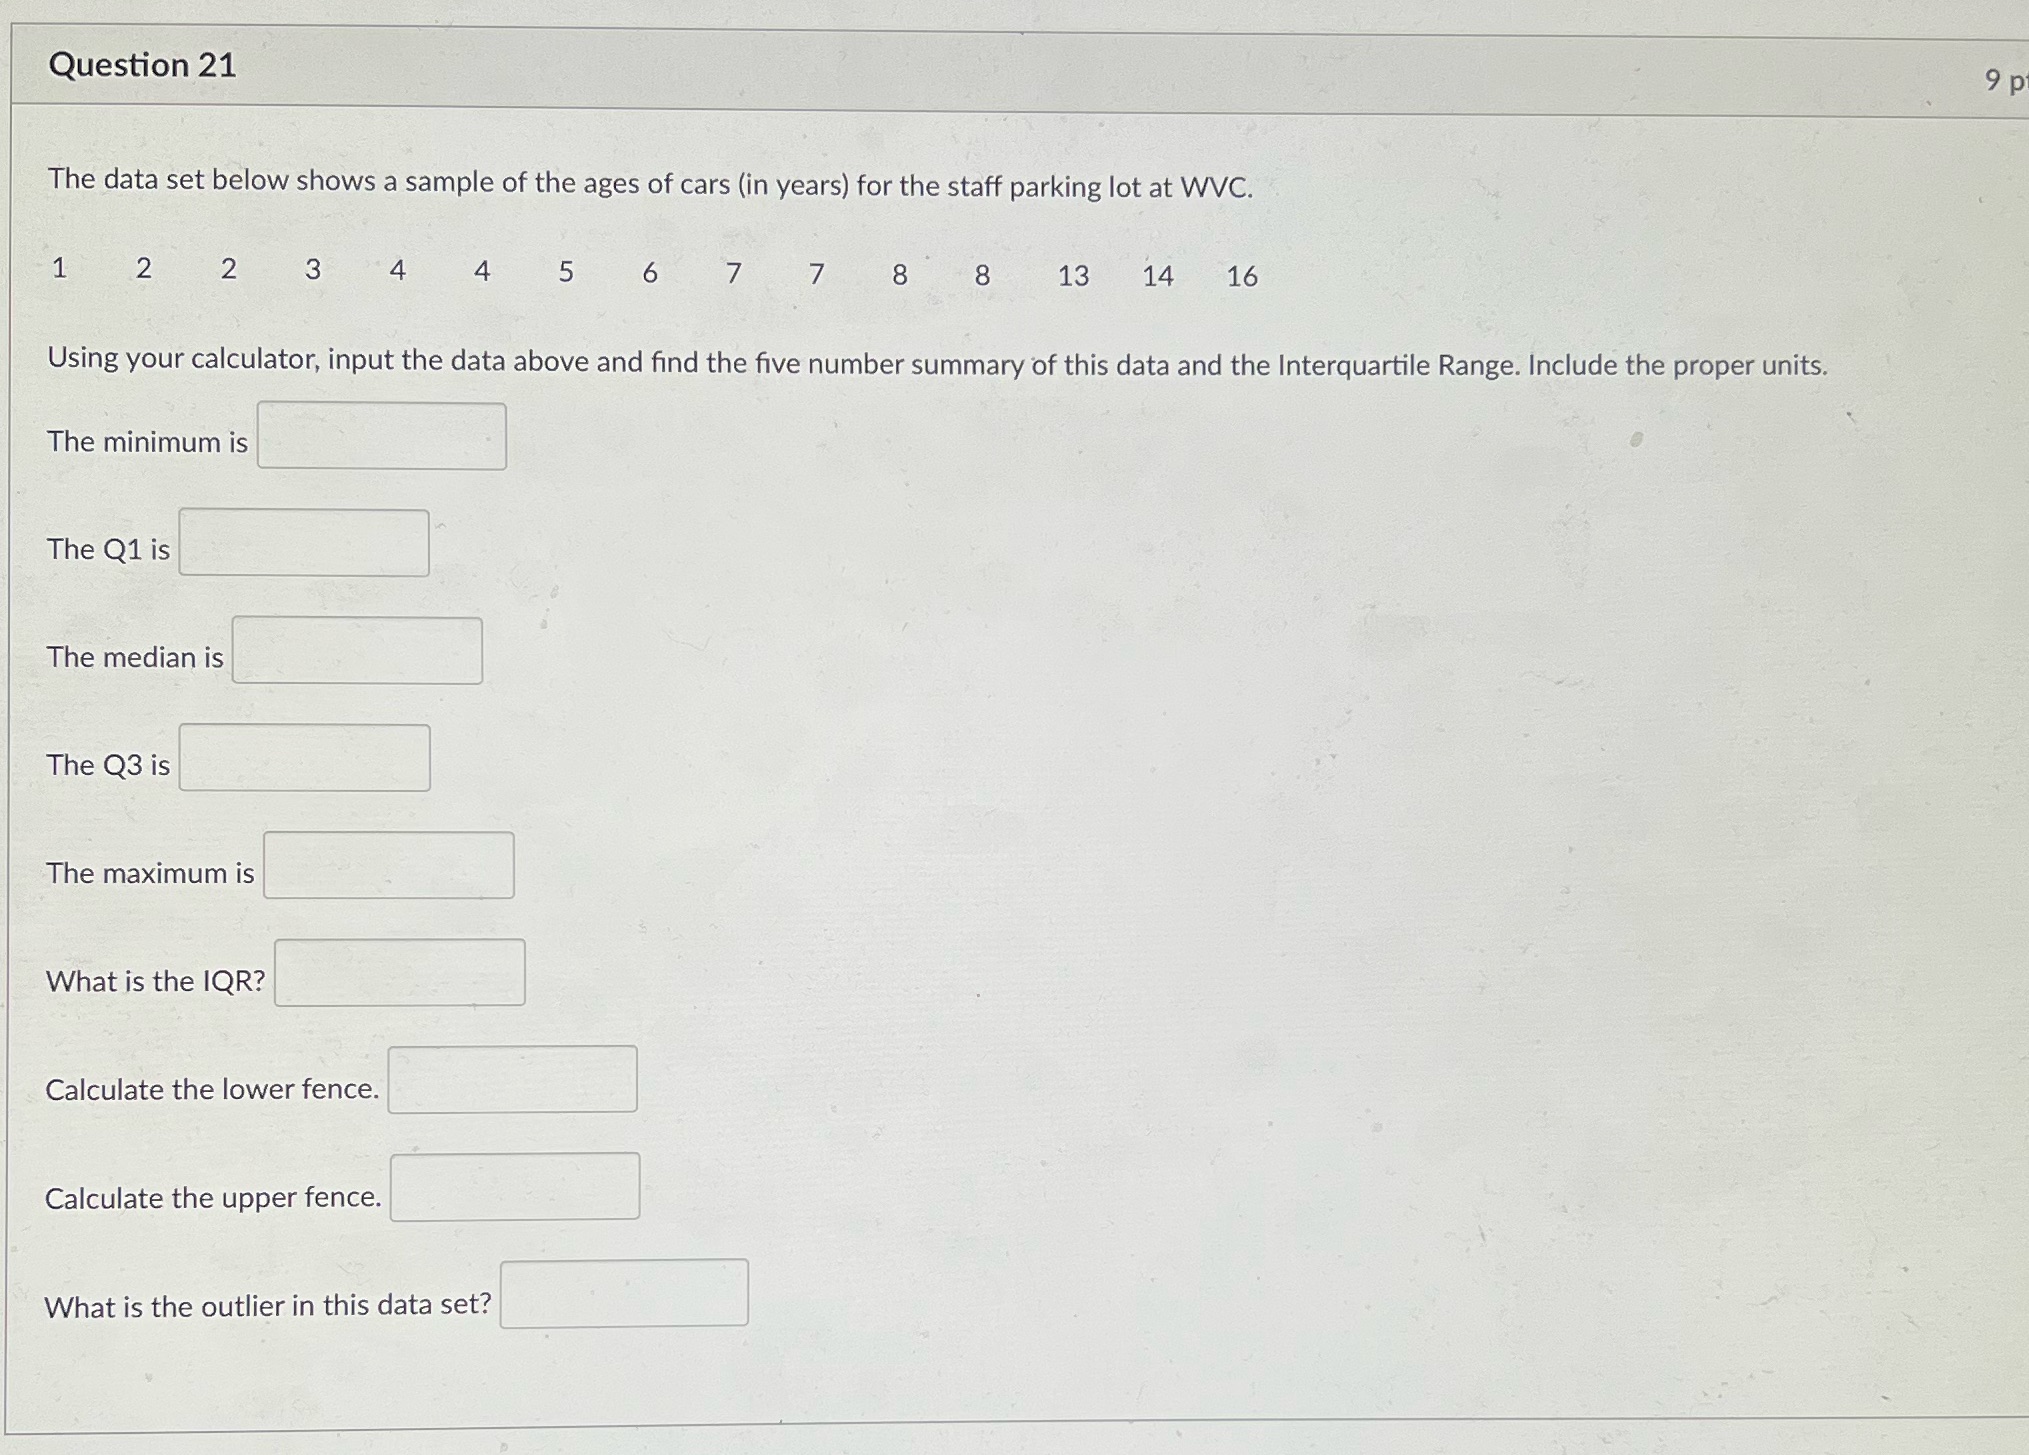
Question 21 9 p The data set below shows a sample of the ages of cars (in years) for the staff parking lot at WVC. 1 2 2 3 4 4 5 6 7 7 8 8 13 14 16 Using your calculator, input the data above and find the five number summary of this data and the Interquartile Range. Include the proper units. The minimum is The Q1 is The median is The Q3 is The maximum is What is the IQR? Calculate the lower fence. Calculate the upper fence. What is the outlier in this data set
Step by Step Solution
There are 3 Steps involved in it
1 Expert Approved Answer
Step: 1 Unlock

Question Has Been Solved by an Expert!
Get step-by-step solutions from verified subject matter experts
Step: 2 Unlock
Step: 3 Unlock