

Question: I need help with question 22. I have provided a screen shot of the question along with the charts needed. mentioned, are 23,000 in 20X0
I need help with question 22. I have provided a screen shot of the question along with the charts needed.
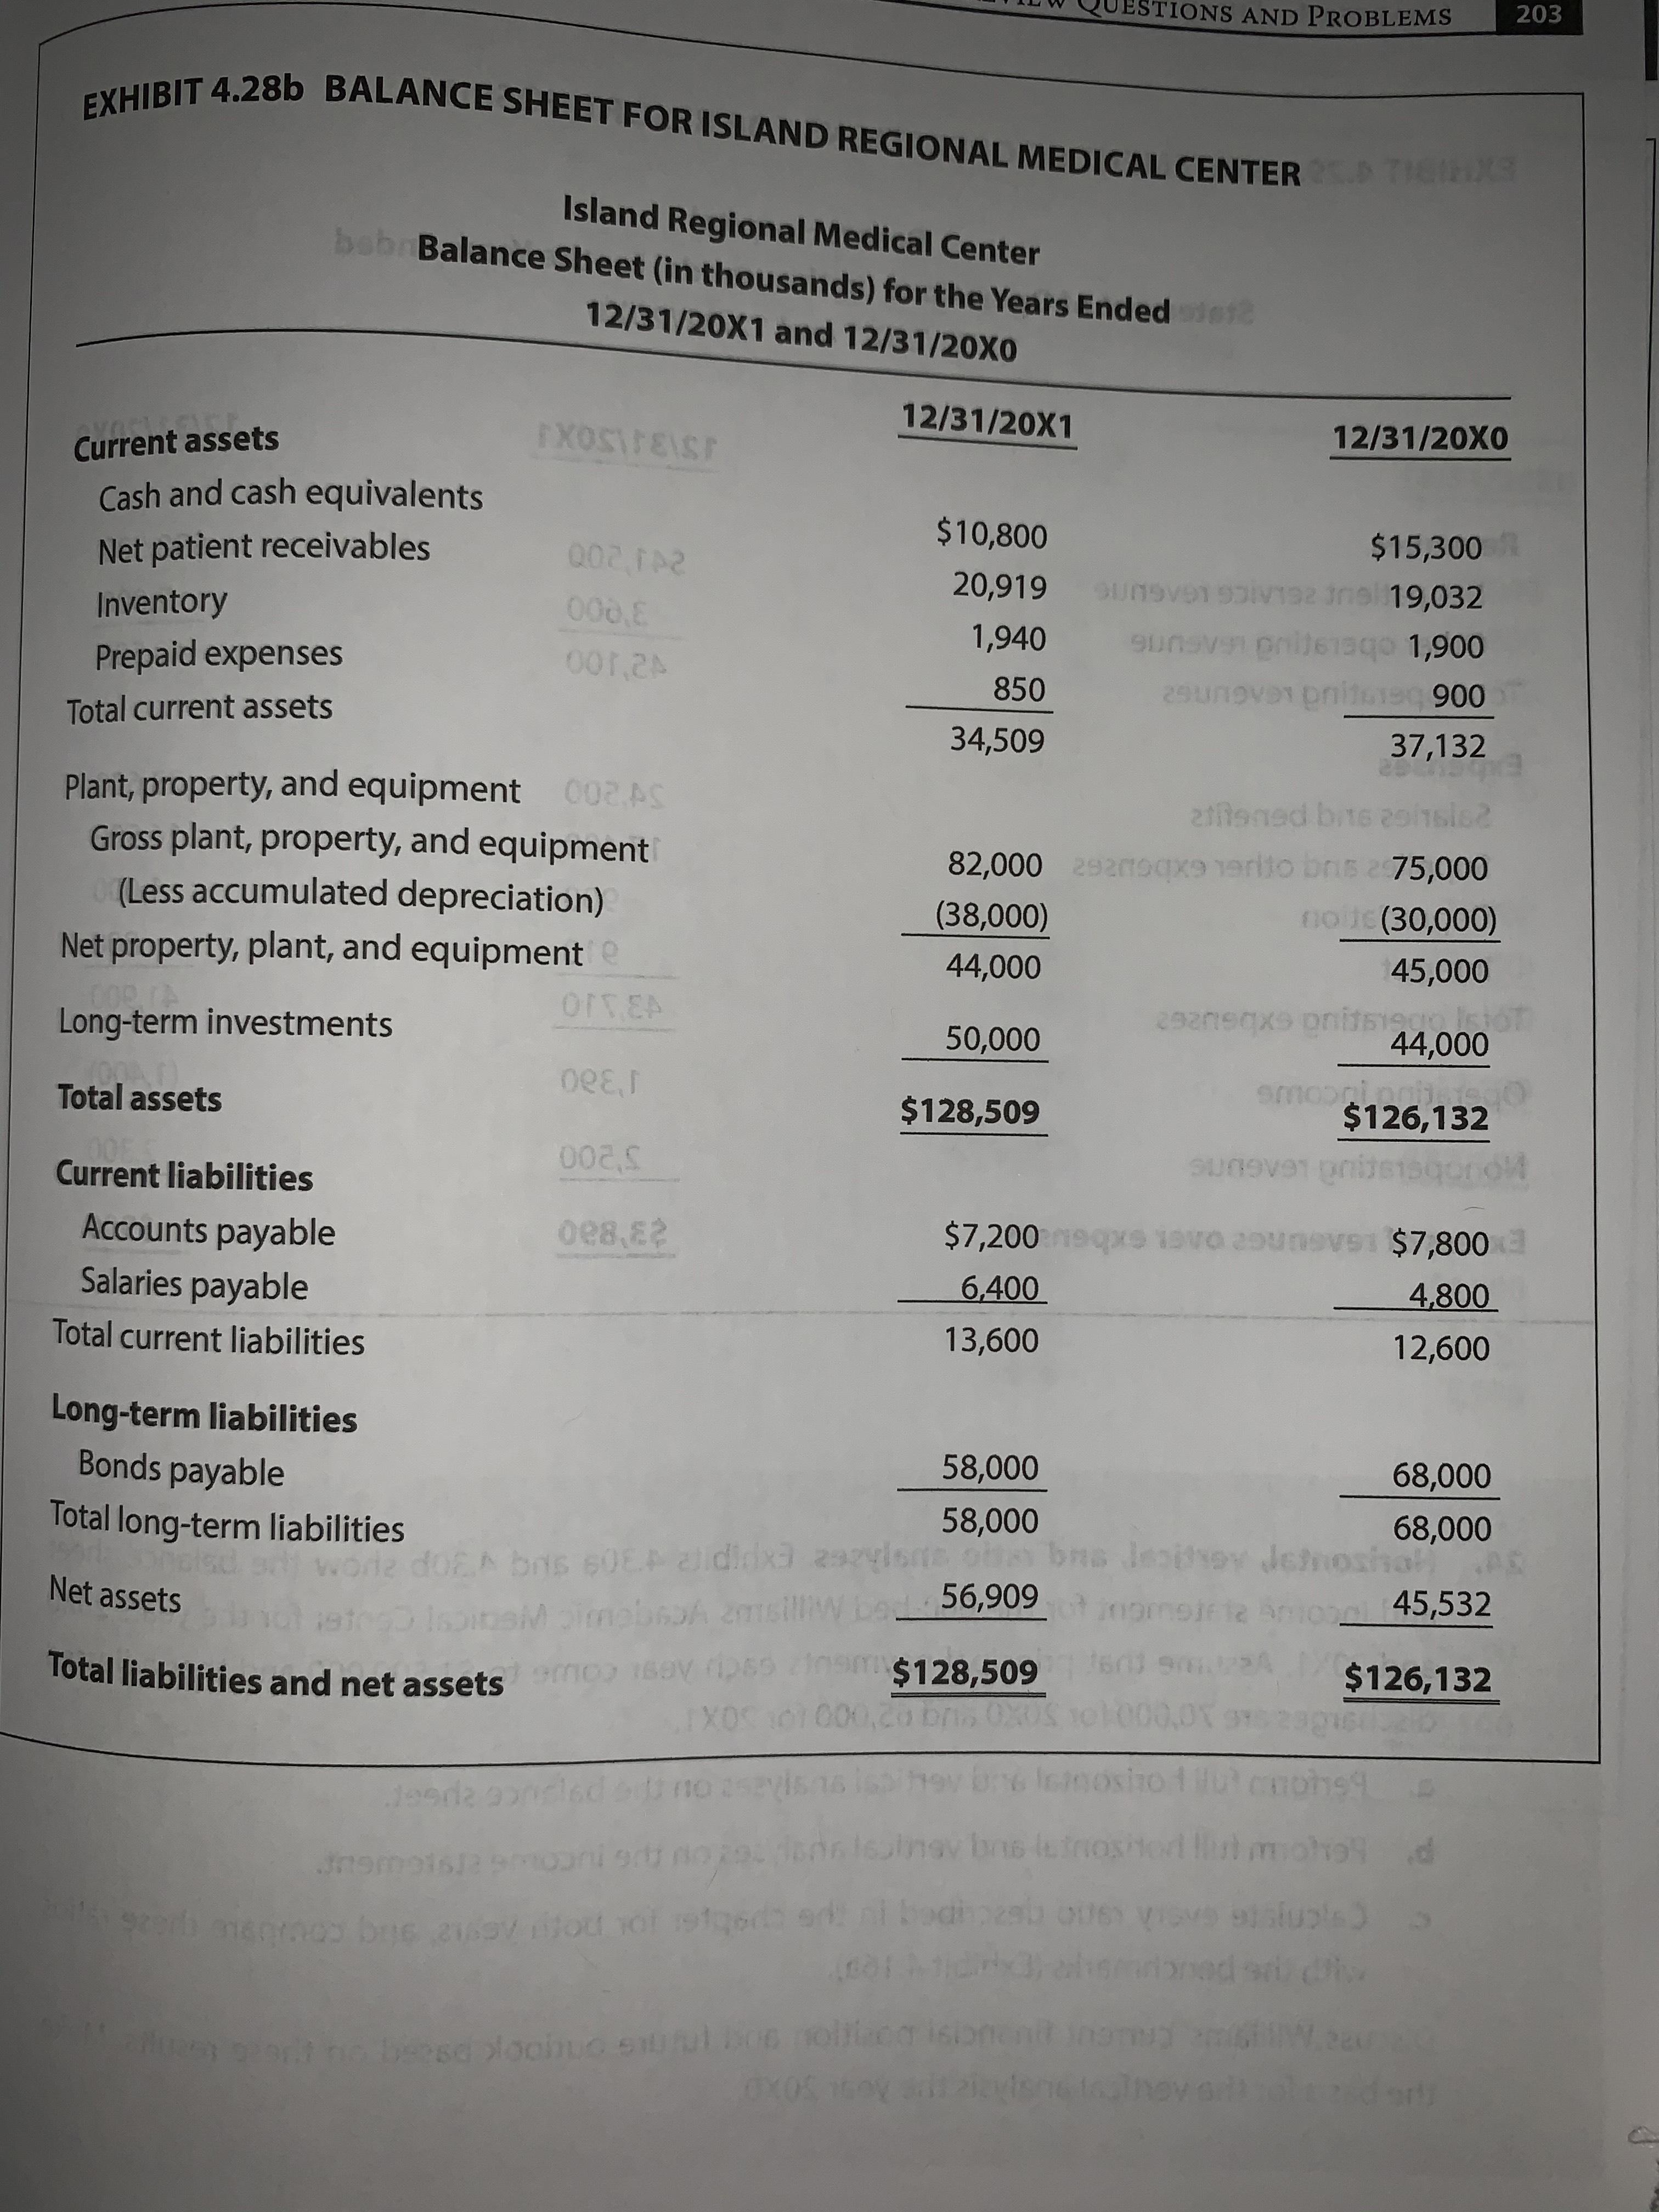
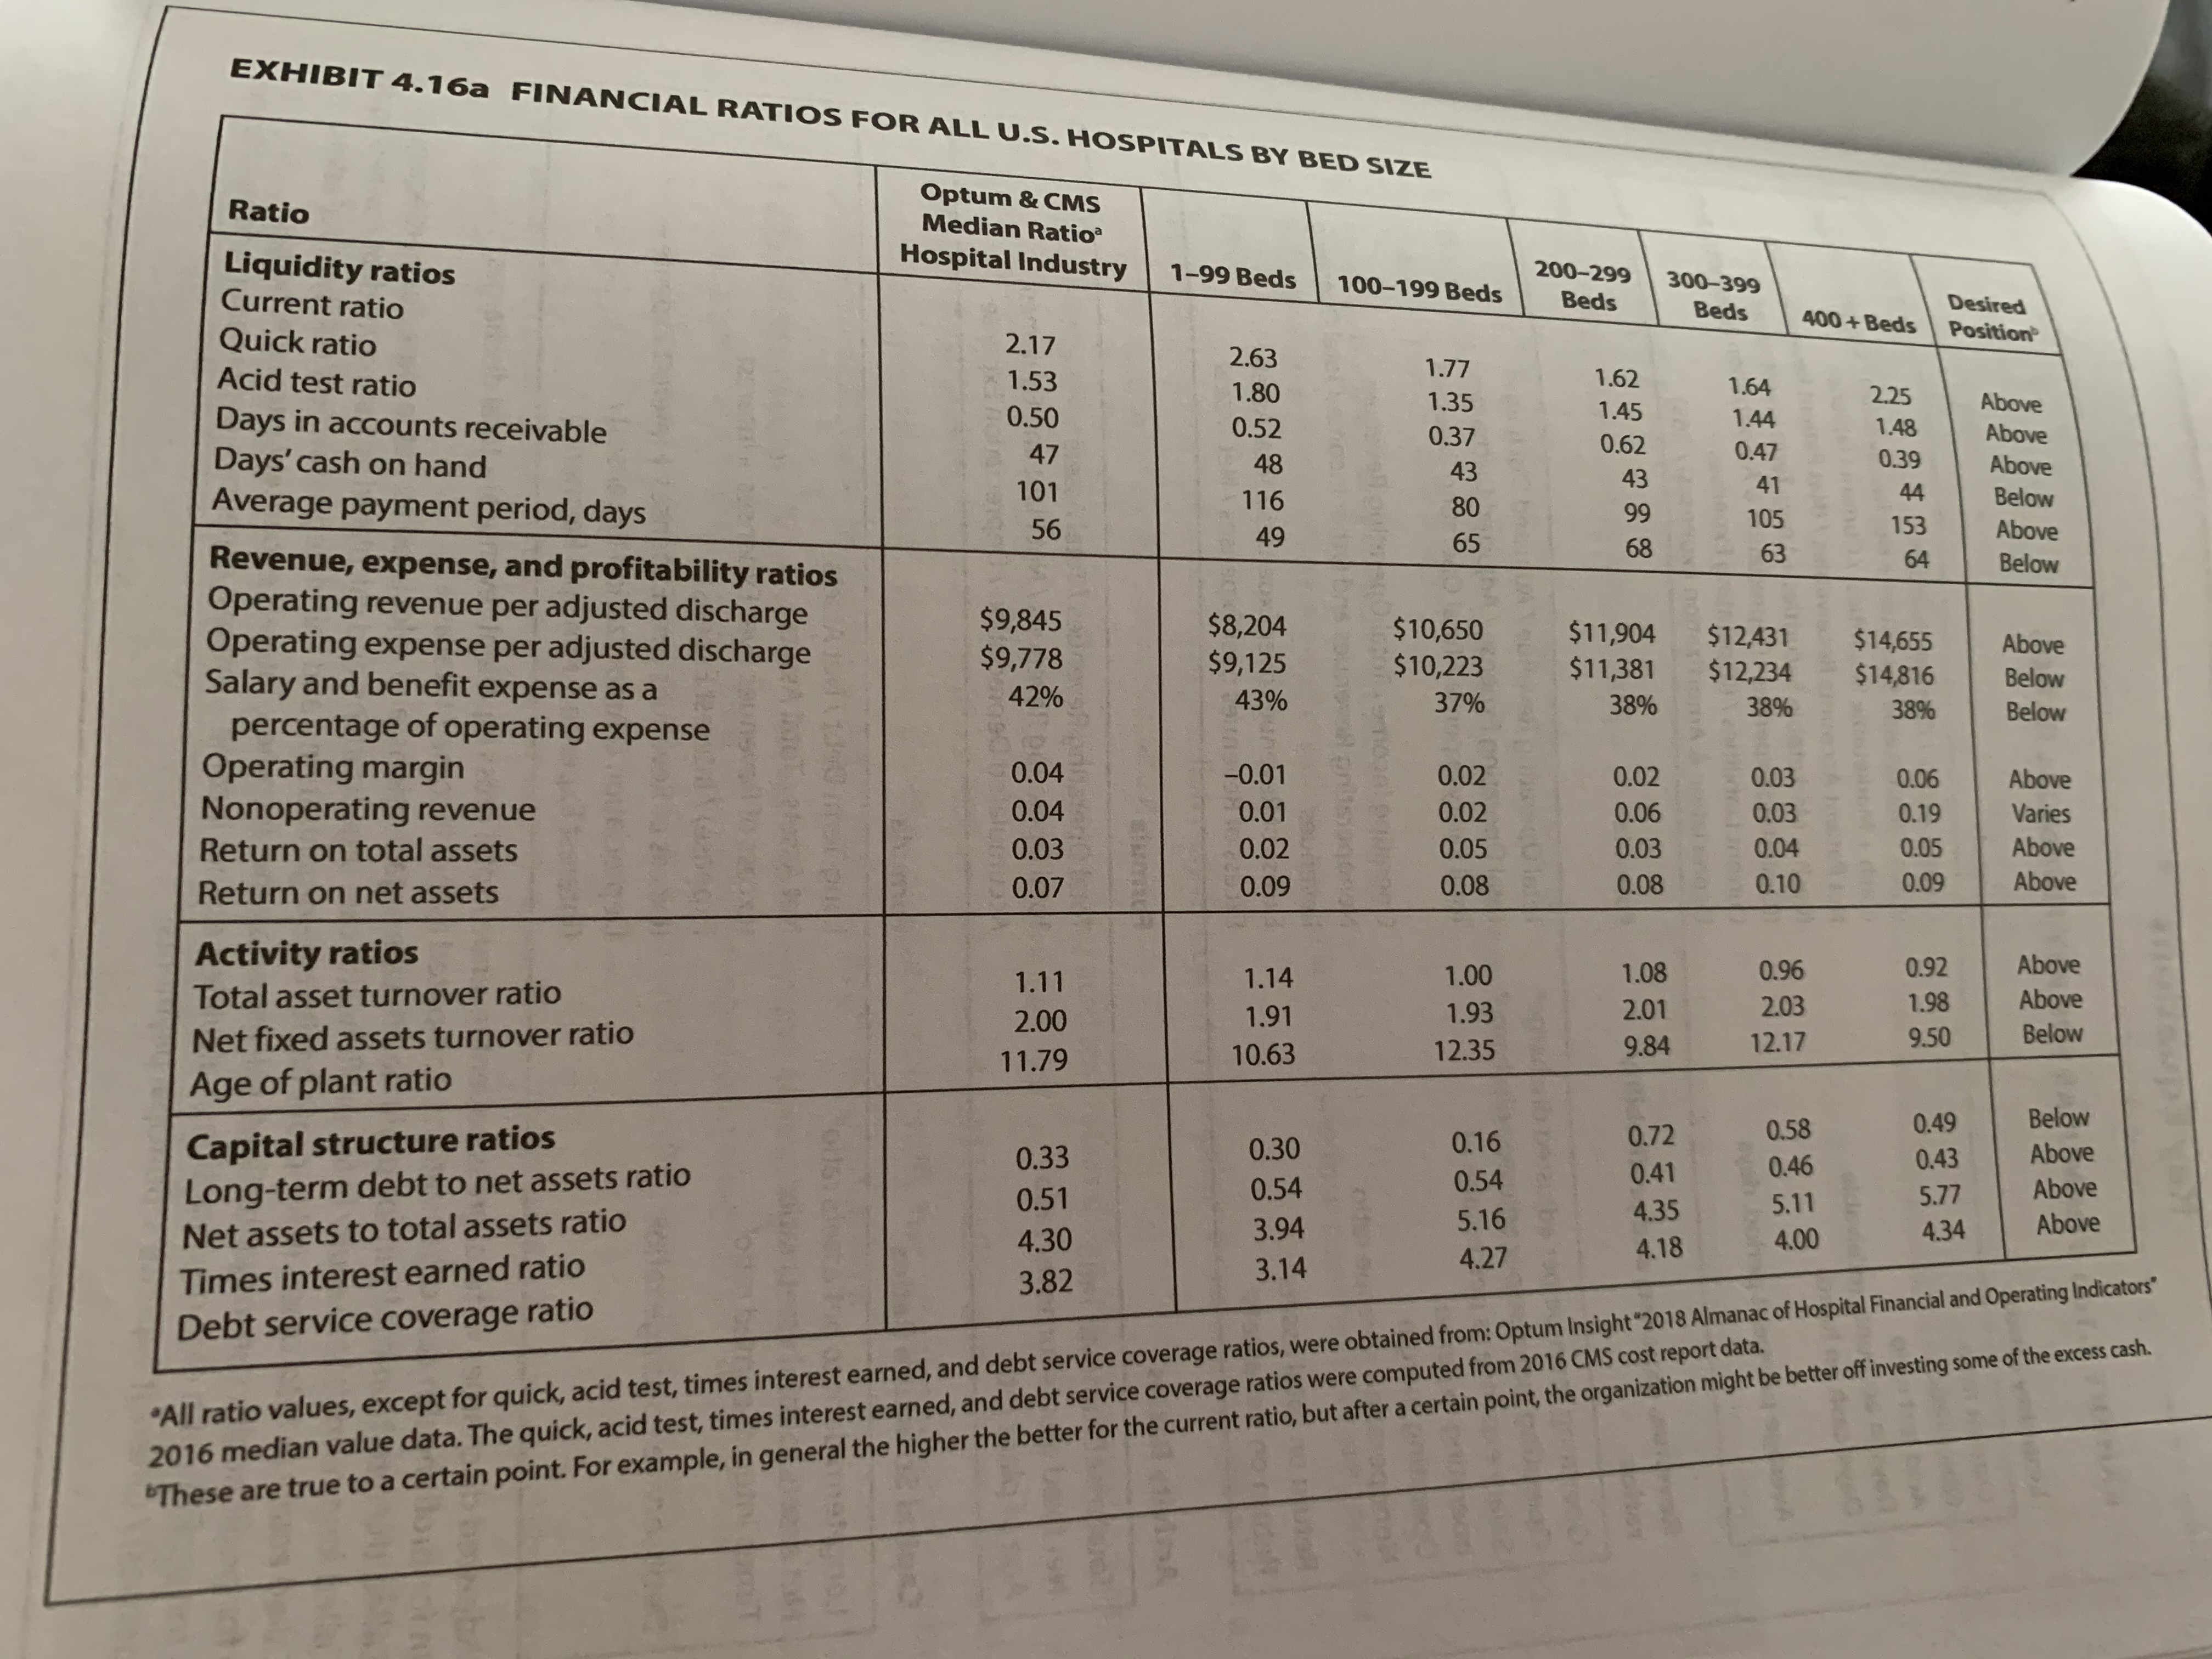
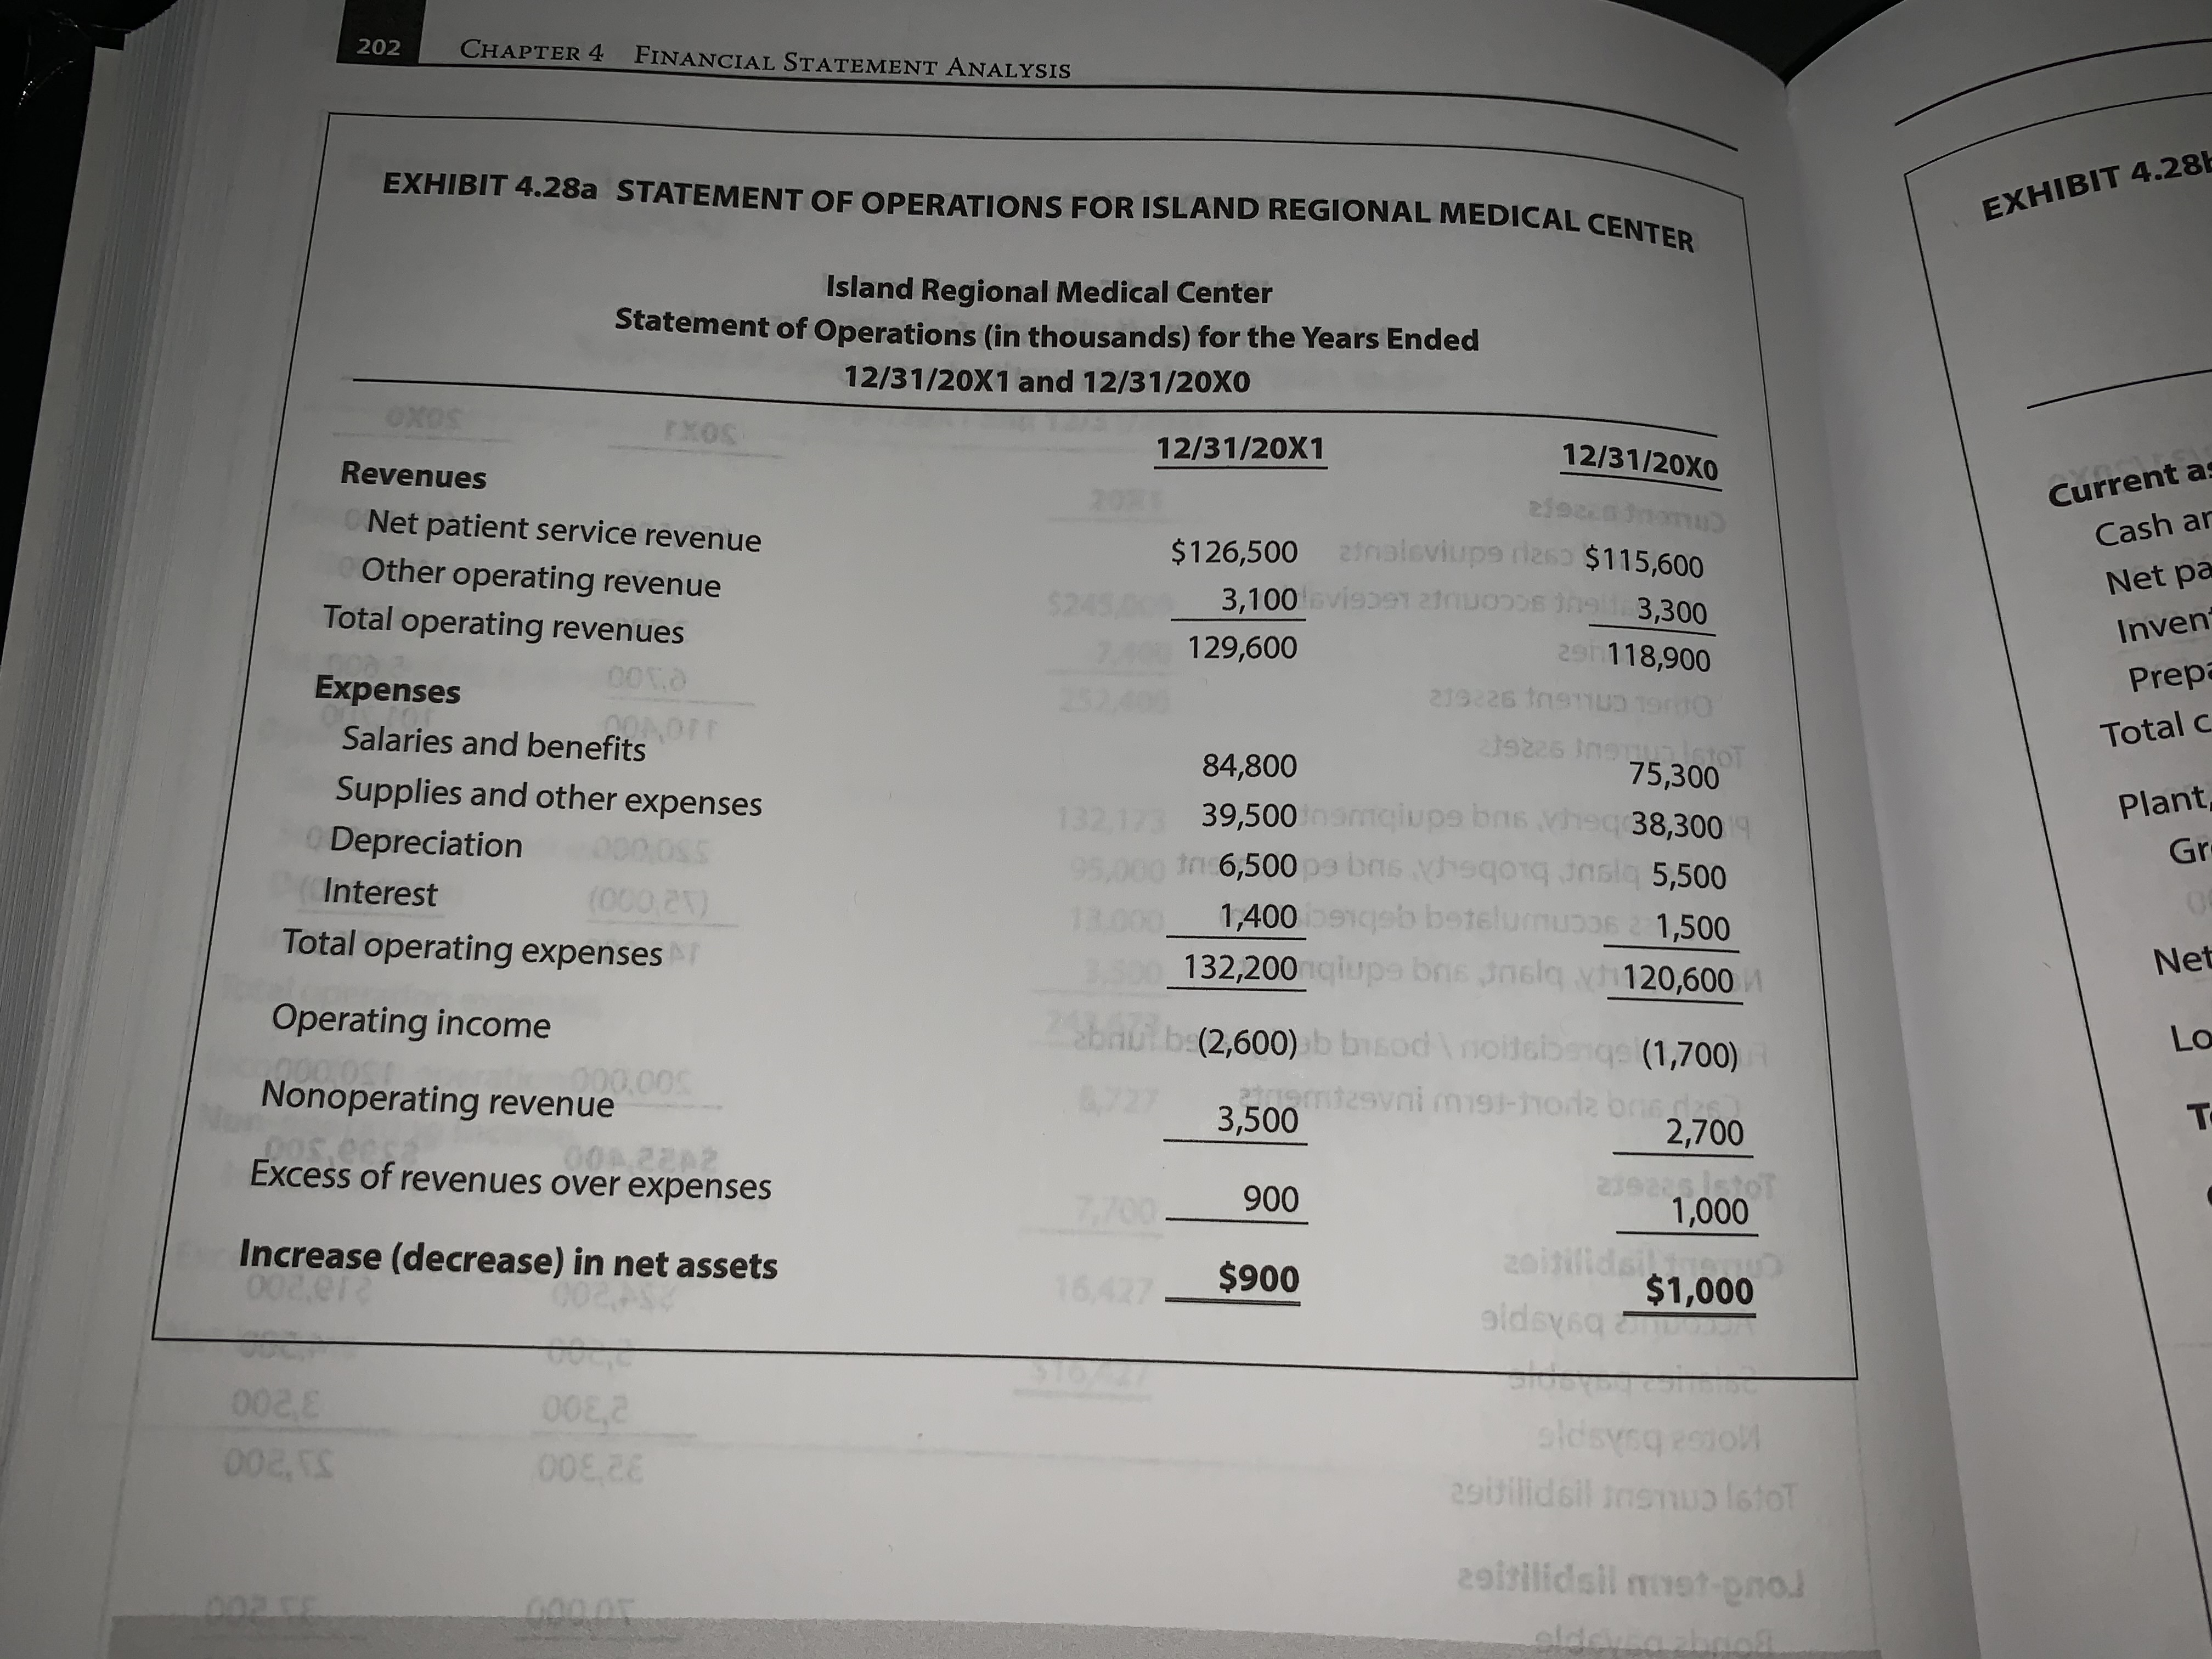
mentioned, are 23,000 in 20X0 and 24,000 in 20X1. 22. Horizontal, vertical, and ratio analyses. Exhibits 4.28a and 4.28b show the statement of operations and balance sheet for the 375-bed Island Regional Medical Center for 20X0 and 20X1. a. Perform a horizontal analysis on both statements. b. Perform a vertical analysis on both statements relative to 20X0. c. Compute all the selected ratios listed in Exhibit 4.16a, and compare them with the bench- marks for its bed size. Using these financial performance measures, evaluate the financial state of Island. The debt principal payments each year are $1,800,000, and adjusted discharges are 11,000 for 20X0 and 11,500 for 20X1.JESTIONS AND PROBLEMS 203 EXHIBIT 4.286 BALANCE SHEET FOR ISLAND REGIONAL MEDICAL CENTER. Island Regional Medical Center bob Balance Sheet (in thousands) for the Years Ended 12/31/20X1 and 12/31/20X0 12/31/20X1 Current assets EXOSIFEIST 12/31/20X0 Cash and cash equivalents Net patient receivables Q02, 102 $10,800 $15,300 Inventory 20,919 Sunsver spiv152 inel 19,032 Prepaid expenses oor,as 1,940 gunsven onit613q0 1,900 850 900 Total current assets 34,509 37,132 Plant, property, and equipment Co2.PS Gross plant, property, and equipment 82,000 292mogx9 verito bnis a:75,000 (Less accumulated depreciation) (38,000) no 1 (30,000) Net property, plant, and equipment e 44,000 45,000 Long-term investments OFFER 50,000 asaneqxs onitsin 44,000 Total assets $128,509 smo $126,132 Current liabilities sunever onitsis Accounts payable $7,200 eqxs isVO 29unSVS1 $7,800 Salaries payable 6,400 4,800 Total current liabilities 13,600 12,600 Long-term liabilities Bonds payable 58,000 68,000 Total long-term liabilities 58,000 68,000 worte doen bris BOE.P alldidx 292ylene ons Jesthey demosha Net assets 56,909 45,532 Total liabilities and net assets sav 259 nom $128,509 $126,132 .IX09 101 000,co bris US 101 000,08 915 2381 Jeerde aoneled and no asevisas ley hey bre lemosho flu) comes Jrompisha emoani arts no pad dens lainey bas it frosted list moneyEXHIBIT 4.16a FINANCIAL RATIOS FOR ALL U.S. HOSPITALS BY BED SIZE Ratio Optum & CMS Median Ratio Liquidity ratios Hospital Industry Current ratio 1-99 Beds 100-199 Beds 200-299 Beds 300-399 Desired Quick ratio Beds 2.17 400 + Beds Acid test ratio 1.53 2.63 Position 1.77 1.62 Days in accounts receivable 0.50 1.80 1.35 1.64 2.25 0.52 Above Days' cash on hand 47 0.37 1.45 1.44 43 0.47 1.48 Above 101 48 0.62 43 0.39 Average payment period, days 116 80 99 41 Above 105 44 in Below 65 8 153 Revenue, expense, and profitability ratios 63 Above Below Operating revenue per adjusted discharge Operating expense per adjusted discharge $9,845 $8,204 $9,778 $10,650 $9,125 $11,904 $10,223 $12,431 $11,381 $14,655 Salary and benefit expense as a 12% $12,234 Above 43% 37% $14,816 38% Below percentage of operating expense 38% 38% Below Operating margin 0.04 Nonoperating revenue -0.01 0.02 0.02 0.03 0.04 0.06 Above 0.01 0.02 0.06 Return on total assets 0.03 0.19 Varies 0.03 0.02 0.05 0.03 0.04 0.05 Above Return on net assets 0.07 0.09 0.08 0.08 0.10 0.09 Above Activity ratios Total asset turnover ratio 1.11 1.14 1.00 1.08 0.96 0.92 Above Net fixed assets turnover ratio 2.00 1.91 1.93 2.01 2.03 1.98 Above Age of plant ratio 11.79 10.63 12.35 9.84 12.17 9.50 Below Capital structure ratios 0.30 0.16 0.72 0.58 0.49 Below Long-term debt to net assets ratio 0.33 0.51 0.54 0.41 Above 0.54 0.46 0.43 Net assets to total assets ratio 5.11 5.77 Above Times interest earned ratio 4.30 3.94 5.16 4.35 4.00 4.34 3.14 4.27 4.18 Above Debt service coverage ratio 3.82 "All ratio values, except for quick, acid test, times interest earned, and debt service coverage ratios, were obtained from: Optum Insight "2018 Almanac of Hospital Financial and Operating Indicators" 2016 median value data. The quick, acid test, times interest earned, and debt service coverage ratios were computed from 2016 CMS cost report data. "These are true to a certain point. For example, in general the higher the better for the current ratio, but after a certain point, the organization might be better off investing some of the excess cash.202 CHAPTER 4 FINANCIAL STATEMENT ANALYSIS EXHIBIT 4.28 EXHIBIT 4.28a STATEMENT OF OPERATIONS FOR ISLAND REGIONAL MEDICAL CENTER Island Regional Medical Center Statement of Operations (in thousands) for the Years Ended 12/31/20X1 and 12/31/20X0 OXOs rxos 12/31/20X1 12/31/20XO Current a Revenues Cash a Net patient service revenue $126,500 atnaleviups ness $115,600 Net pa Other operating revenue 3,100 avisse1 2fruGo56 19 1 3,300 Inven Total operating revenues 129,600 29 118,900 Prep Expenses 219 26 1797143 19010 Total c Salaries and benefits 84,800 219226 Ins 75,300 Supplies and other expenses Plant 132 173 39,500 namqiups bus Yheg 38,300 Depreciation $5,060 1 6,500 pa bas Yhsgorq ansig 5,500 Interest (000 25) 13,000 1,400 59qeb betslumusos 2 1,500 Total operating expenses 132,200 qlupe bris Jnelq v120,600 Ne Operating income Zabout be(2,600) b bisod \\ noltebeige (1,700) Nonoperating revenue 20.005 6,727 3,500 nitesvni mist-horde bre 2,700 Excess of revenues over expenses 900 1,000 Increase (decrease) in net assets 16,427. $900 $1,000 oldsysq OOE,2 slidsysq essoll 290ilidsil menino Isfor zoisilidsil mist-pool
Step by Step Solution
There are 3 Steps involved in it

Get step-by-step solutions from verified subject matter experts