

Question: I need help with question 2-4. This is a practice assignment and only need help with question 2-4 to help me understand how to achieve

I need help with question 2-4.
This is a practice assignment and only need help with question 2-4 to help me understand how to achieve the answer nothing will be considered copied. There is no academic integrity violation please do the work.


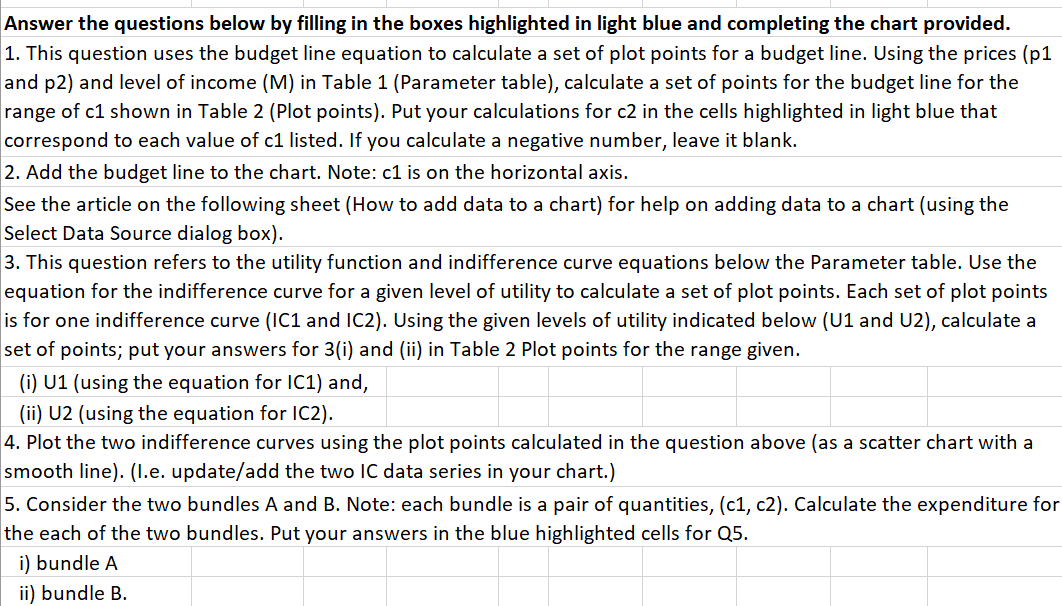
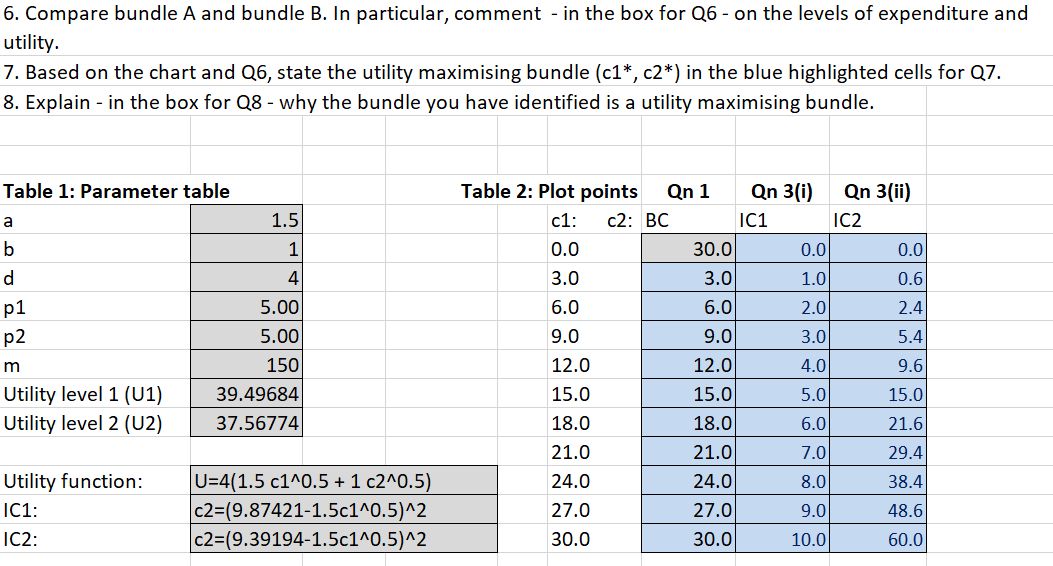
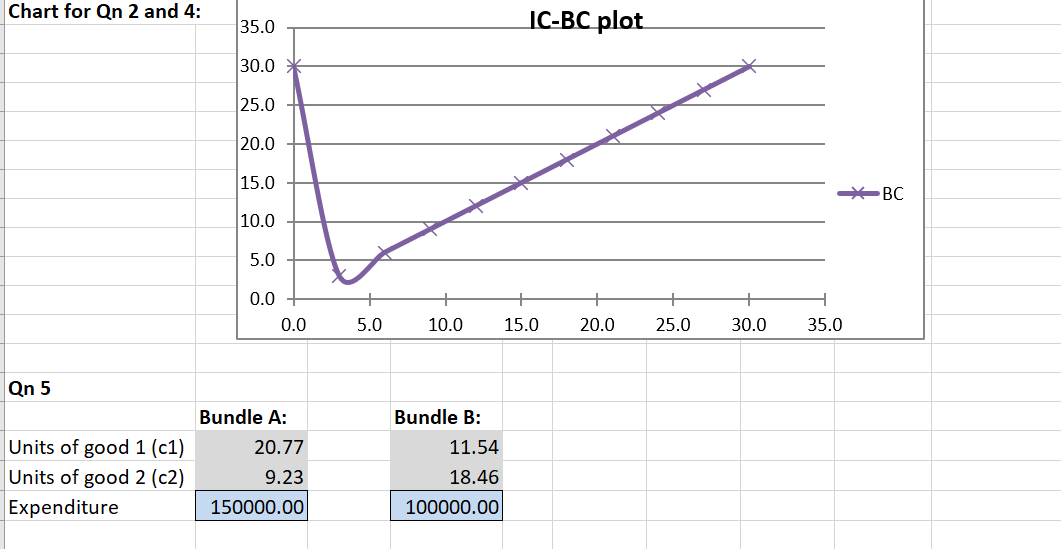
6. Compare bundle A and bundle B. In particular, comment - in the box for Q6 - on the levels of expenditure and utility. 7. Based on the chart and [16, state the utility maximising bundle (c1*, c2\") in the blue highlighted cells for Q7. 3. Explain - in the box for Q8 - why the bundle you have identified is a utility maximising bundle. Table 1: Parameter table Table 2: Plot points a c1: c2: b 0.0 d 3.0 p1 p2 m Utility level 1 (U1) Utility level 2 (U2) Utility function: IC1: ICZ: \fAnswer the questions below by filling in the boxes highlighted in light blue and completing the chart provided. 1. This question uses the budget line equation to calculate a set of plot points for a budget line. Using the prices (p1 and p2) and level of income (M) in Table 1 {Parametertable}, calculate a set of points for the budget line for the range of Cl shown in Table 2 (Plot points). Put your calculations for c2 in the cells highlighted in light blue that correspond to each value of c1 listed. If you calculate a negative number, leave it blank. 2. Add the budget line to the chart. Note: c1 is on the horizontal axis. See the article on the following sheet (How to add data to a chart] for help on adding data to a chart (using the Select Data Source dialog box). 3. This question refers to the utility function and indifference curve equations below the Parameter table. Use the equation for the indifference curve for a given level of utility to calculate a set of plot points. Each set of plot points is for one indifference curve (IC1 and IC2). Using the given levels of utility indicated below (U1 and U2), calculate a set of points; put your answers for 3(i] and (ii) in Table 2 Plot points for the range given. (i) U1 (using the equation for IC1) and, (ii) U2 (using the equation for |C2]. 4. Plot the two indifference curves using the plot points calculated in the question above (as a scatter chart with a smooth line). (|.e. update/add the two IC data series in your chart.) 5. Consider the two bundles A and B. Note: each bundle is a pair of quantities, (c1, c2). Calculate the expenditure for the each of the two bundles. Put your answers in the blue highlighted cells for Q5. i) bundleA ii] bundle B
Step by Step Solution
There are 3 Steps involved in it

Get step-by-step solutions from verified subject matter experts