

Question: I need help with question #3 (2020) (2019) any help is appreciated You are all Equity Researchers for a financial services company in which I
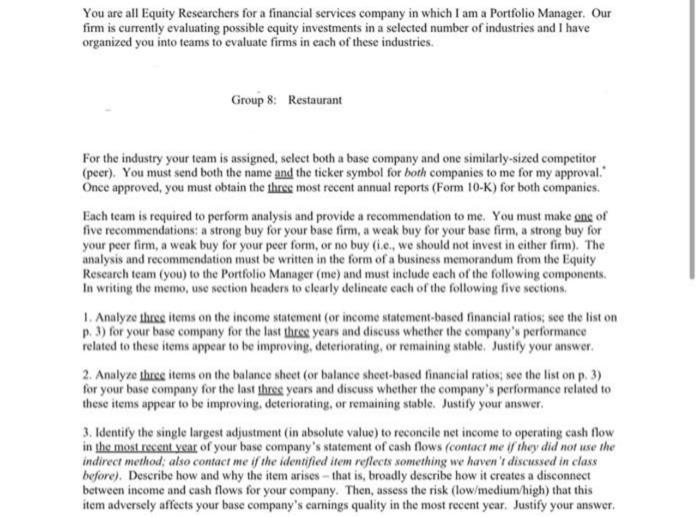
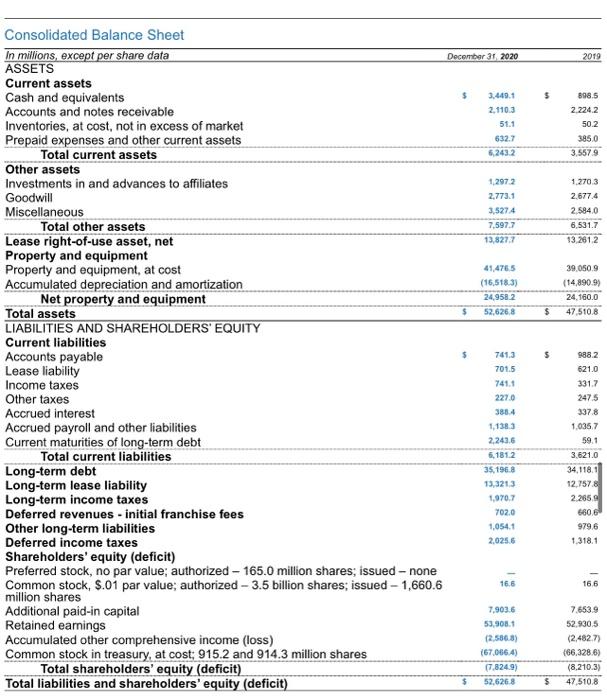
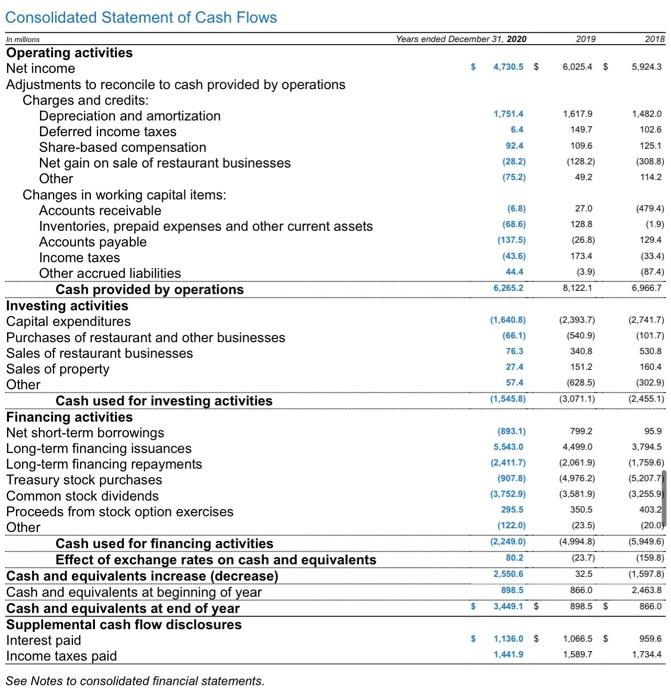
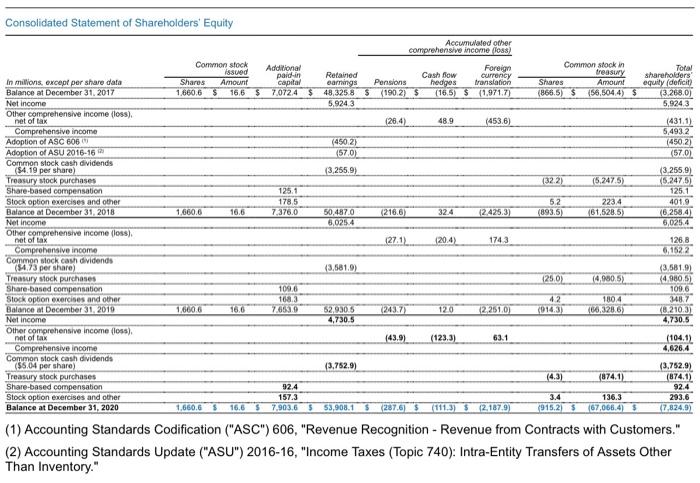
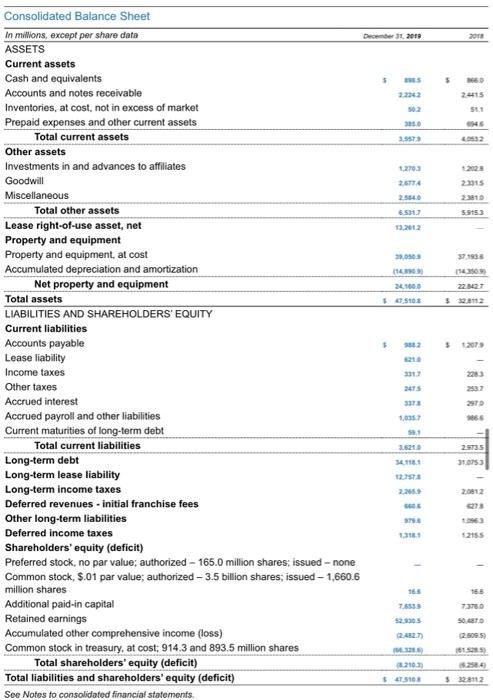
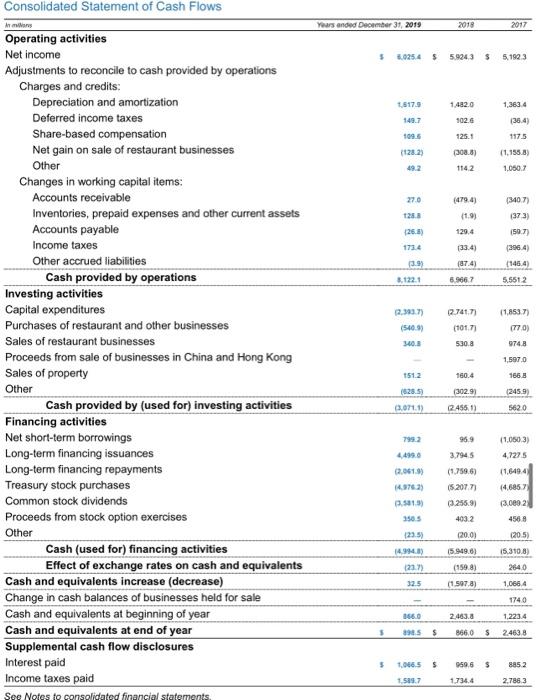
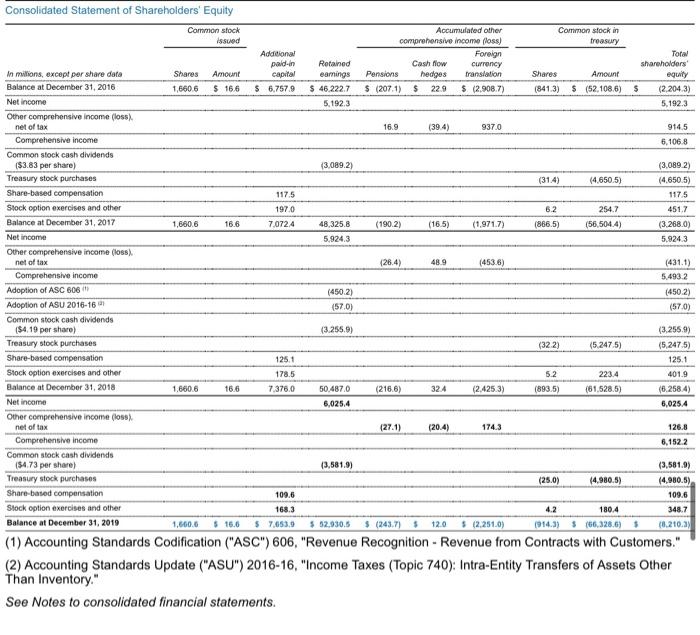
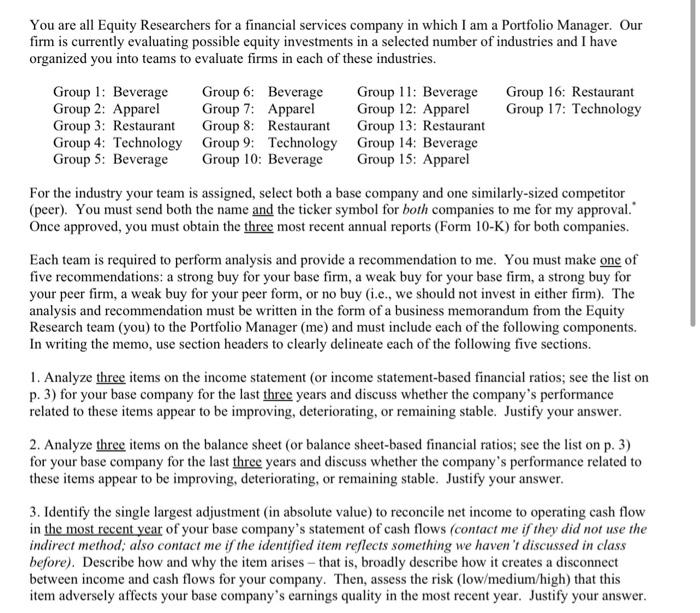
You are all Equity Researchers for a financial services company in which I am a Portfolio Manager. Our firm is currently evaluating possible equity investments in a selected number of industries and I have organized you into teams to evaluate firms in each of these industries. Group 8: Restaurant For the industry your team is assigned, select both a base company and one similarly-sized competitor (peer). You must send both the name and the ticker symbol for both companies to me for my approval Once approved, you must obtain the three most recent annual reports (Form 10-K) for both companies. Each team is required to perform analysis and provide a recommendation to me. You must make one of five recommendations: a strong buy for your base firm, a weak buy for your base firm, a strong buy for your peer firm, a weak buy for your peer form, or no buy lie, we should not invest in either firm). The analysis and recommendation must be written in the form of a business memorandum from the Equity Research team (you) to the Portfolio Manager (me) and must include each of the following components. In writing the memo, use section headers to clearly delineate each of the following five sections 1. Analyze the items on the income statement or income statement-based financial ratios, see the list on p. 3) for your base company for the last three years and discuss whether the company's performance related to these items appear to be improving, deteriorating, or remaining stable. Justify your answer 2. Analyze three items on the balance sheet (or balance sheet-based financial ratios: see the list on p3) for your base company for the last three years and discuss whether the company's performance related to these items appear to be improving, deteriorating, or remaining stable. Justify your answer. 3. Identify the single largest adjustment (in absolute value) to reconcile net income to operating cash flow in the most recent year of your base company's statement of cash flows (contact me if they did not use the indirect method, also contact me if the identified item reflects something we haven't discussed in class before). Describe how and why the item arises - that is, broadly describe how it creates a disconnect between income and cash flows for your company. Then, assess the risk (low/medium/high) that this item adversely affects your base company's earnings quality in the most recent year. Justify your answer 2019 $ 898.5 2.224.2 502 385.0 3,5579 1.270.3 2.677.4 2.584,0 6,531.7 13.261.2 39.050.9 (14,8909) 24.160.0 47.5108 $ $ $ 5 Consolidated Balance Sheet In millions, except per share data December 31, 2020 ASSETS Current assets Cash and equivalents 3.449.1 Accounts and notes receivable 2.110.3 Inventories, at cost, not in excess of market 51.1 Prepaid expenses and other current assets 632.7 Total current assets 6,243.2 Other assets Investments in and advances to affiliates 1.2972 Goodwill 2,773.1 Miscellaneous 3.5274 Total other assets 7,597,7 Lease right-of-use asset, net 13,8277 Property and equipment Property and equipment, at cost 41,476,5 Accumulated depreciation and amortization (16,518.3) Net property and equipment 24,9582 Total assets 52,626,8 LIABILITIES AND SHAREHOLDERS' EQUITY Current liabilities Accounts payable 741.3 Lease liability 7015 Income taxes 741.1 Other taxes 227.0 Accrued interest 388.4 Accrued payroll and other liabilities 1,1383 Current maturities of long-term debt 2,243.6 Total current liabilities 6,181.2 Long-term debt 35,1968 Long-term lease liability 13.3213 Long-term income taxes 1,970.7 Deferred revenues - initial franchise fees 702.0 Other long-term liabilities 1,054.1 Deferred income taxes 2,025.6 Shareholders' equity (deficit) Preferred stock, no par value; authorized - 165.0 million shares, issued - none Common stock, 8.01 par value; authorized - 3.5 billion shares; issued - 1,660.6 million shares Additional paid-in capital 7.903.6 Retained earnings 53.903.1 Accumulated other comprehensive income (loss) (2.5863) Common stock in treasury, at cost; 915.2 and 914.3 million shares (67.066.4) Total shareholders' equity (deficit) (7.8249) Total liabilities and shareholders' equity (deficit) 52,6268 988.2 621.0 331.7 2475 3378 1.0357 59.1 3.621.0 34,118.1 12.7578 2 2659 6606 979,6 1.318.1 - 16.6 16.6 7.653.9 52.930.5 (2,482.7) (66.328,6) (8.210.3) 47,510.8 $ $ Consolidated Statement of Cash Flows in millions Years ended December 31, 2020 2019 2018 $ 4.730.5$ 6,025.4 5,924.3 1,751.4 6.4 92.4 (28.2) (75.2) 1.617.9 149.7 109.6 (1282) 49.2 1.482.0 102.6 125.1 (308.8) 114.2 (6.8) (68.6) (137.5) (43.6) 44.4 6,265.2 27.0 128.8 (26.8) 173.4 (3.9) 8,122.1 (479.4) (1.9) 129.4 (33.4) (874) 6,966.7 (2,393.7) (540.9) 340.8 Operating activities Net income Adjustments to reconcile to cash provided by operations Charges and credits: Depreciation and amortization Deferred income taxes Share-based compensation Net gain on sale of restaurant businesses Other Changes in working capital items: Accounts receivable Inventories, prepaid expenses and other current assets Accounts payable Income taxes Other accrued liabilities Cash provided by operations Investing activities Capital expenditures Purchases of restaurant and other businesses Sales of restaurant businesses Sales of property Other Cash used for investing activities Financing activities Net short-term borrowings Long-term financing issuances Long-term financing repayments Treasury stock purchases Common stock dividends Proceeds from stock option exercises Other Cash used for financing activities Effect of exchange rates on cash and equivalents Cash and equivalents increase (decrease) Cash and equivalents at beginning of year Cash and equivalents at end of year Supplemental cash flow disclosures Interest paid Income taxes paid See Notes to consolidated financial statements. (1.640.8) (66.1) 76.3 27.4 57.4 (1,545.8) (2.741.7) (101.7) 530.8 160.4 (3029) (2.455.1) 151.2 (628.5) (3,071.1) 7992 (893.1) 5,543.0 (2,411.7) (907.8) (3.752.9) 295.5 (122.0) (2.249.0) 80.2 4,499.0 (2.061.9) (4.976.2) (3.581.9) 350.5 (23.5) (4.994.8) (23.7) 32.5 95.9 3.794.5 (1.759.6) (5.207.71 (3.255.9) 403.2 (20.0) (5.949.6) (159.8) (1.597.8) 2,550.6 898.5 3,449.1 $ 866.0 2,463.8 $ 898.5 5 866.0 $ 1,136.0 $ 1.441.9 1,066.5$ 1,589.7 959.6 1.7344 Consolidated Statement of Shareholders' Equity Accumulated other comprehensive income (loss) Common stock issued Additional Foreign paid in Retained Cash Bow currency Shares Amount Capital earnings Pensions Hedges translation 1,660,6 $ 16.65 7,0724 $ 48,3258 S (1902) $ (16.5) $11.971.71 5.9243 Common stock in treasury Shares Amount (866,5) $ (56,504.4) Tora shareholders' equily (deficit (3.268.0) 5,924.3 (26.4) 48.9 (453.6) (4502) (570) (3,255,9) (4311) 5,4932 (4502) (570) (3.255,9) (5.247,5) 125.1 4019 (6.258.4) 6,025.4 (32.2) (5.247.5) 125.1 178,5 7.376.0 50,487.0 6,025.4 1,660.6 (216.6) 324 5.2 (893.5) (2425.3) 2234 (61,528.5) In millions, except per share data Balance at December 31, 2017 Net income Other comprehensive income (loss). net of tax Comprehensive income Adoption of ASC 606 Adoption of ASU 2016-16 Common stock cash dividends ($4.19 per share) Treasury Mock purchases Share-based compensation Stock option exercises and other Balance at December 31, 2018 Net Income Other comprehensive income foss) net of tax Comprehensive income Common stock cash dividends (54.73 per share Treasury stock purchases Share based compensation Stock option exercises and other Balance at December 31, 2019 Net income Other comprehensive income (los) net of tax Comprehensive income Common stock cash dividends ($5.04 per share) Treasury stock purchases Share-based compensation Stock option exercises and other Balance at December 31, 2020 (271) (20.4) 1743 (3.581.9) (250) (4.080.5) 126,8 6,1622 (3.581.9) (4.980,5) 109.6 348.7 (8.210.3) 4,730.5 1096 1083 76539 42 1600.6 166 (2437) 62,930.5 4.7305 120 (2.251.0) (914,3) 1804 66,328.6) (43.9) (123.3) 63.1 (3.752.9) (4.3) (874.1) (104.1) 4,626.4 (3.752.9) (874.1) 92.4 293.6 (7.824.9) 92.4 157.3 16.6$ 7,903.65 1.660GS (111.3) 32.187.9) 3.4 136.3 (915.2) $ (67,066.4) 3 53,908.1287.6) 3 (1) Accounting Standards Codification ("ASC") 606, "Revenue Recognition - Revenue from Contracts with Customers." (2) Accounting Standards Update ("ASU") 2016-16, "Income Taxes (Topic 740): Intra-Entity Transfers of Assets Other Than Inventory." 2018 5 5 22042 2415 55.1 0532 26714 22315 6531 5.9153 13.2012 7.1985 1139 24.1600 22.1427 5 2012 5 $ 2079 Consolidated Balance Sheet In milions, except per share data December 31, 2019 ASSETS Current assets Cash and equivalents Accounts and notes receivable Inventories, at cost, not in excess of market Prepaid expenses and other current assets 3.0 Total current assets 2.9873 Other assets Investments in and advances to affiliates Goodwill Miscellaneous Total other assets Lease right-of-use asset, net Property and equipment Property and equipment, al cost Accumulated depreciation and amortization (14 Net property and equipment Total assets LIABILITIES AND SHAREHOLDERS' EQUITY Current liabilities Accounts payable Lease liability Income taxes Other taxes Accrued interest Accrued payroll and other liabilities Current maturities of long-term debt Total current liabilities Long-term debt Long-term lease liability 127978 Long-term income taxes Deferred revenues - initial franchise fees Other long-term liabilities Deferred income taxes Shareholders' equity (deficit) Preferred stock, no par value: authorized - 165.0 million shares; issued - none Common stock, 5.01 par value: authorized - 3.5 billion shares; issued - 1,660.6 million shares Additional paid-in capital Retained earnings Accumulated other comprehensive income (loss) Common stock in treasury, at cost: 914.3 and 893.5 million shares Total shareholders' equity (deficit) Total liabilities and shareholders' equity (deficit) See Notes to consolidated financial statements. 2475 23 29 362 2.735 1161 30753 52155 165 TES 7.3780 50 TO 2.500 5 82103 50 2584 53212 Years anded December 31, 2019 2018 2017 3.025.4 5 59243 $ 5.1923 1.482.0 1,363 4 1517.9 1487 109.6 36.4) 102.0 125.1 117.5 (1232 (3088) (1.1583) 2 1142 1,050.1 270 (479.4) (3407) (373) (1.9) 129,4 (507) (26.) 173.4 (33.4) (2964) 329 (87.4) (146.4) 8.122.1 6,9667 5.5512 12,393.7) (5409) 340.3 2.741.77 (1017) 530.a 11,853.7) (770) 9748 Consolidated Statement of Cash Flows An mors Operating activities Net income Adjustments to reconcile to cash provided by operations Charges and credits: Depreciation and amortization Deferred income taxes Share-based compensation Net gain on sale of restaurant businesses Other Changes in working capital items: Accounts receivable Inventories, prepaid expenses and other current assets Accounts payable Income taxes Other accrued liabilities Cash provided by operations Investing activities Capital expenditures Purchases of restaurant and other businesses Sales of restaurant businesses Proceeds from sale of businesses in China and Hong Kong Sales of property Other Cash provided by (used for) investing activities Financing activities Net short-term borrowings Long-term financing issuances Long-term financing repayments Treasury stock purchases Common stock dividends Proceeds from stock option exercises Other Cash (used for) financing activities Effect of exchange rates on cash and equivalents Cash and equivalents increase (decrease) Change in cash balances of businesses held for sale Cash and equivalents at beginning of year Cash and equivalents at end of year Supplemental cash flow disclosures Interest paid Income taxes paid See Notes to consolidated financial statements 1,5970 1512 160.4 1668 (3029) (245.9) (628.5) 3.071.1) 2.455.1) 5620 7992 95.9 (1.050.3) 47275 3,7945 4,499.0 02.061.9) 1.372) 2.501) 3505 (1.759.6) 1520771 (3255.9) 4032 (1.6494 14.685 (3.000 2 4568 (20.01 (205) (235) 14.994.) (23) 15.949.6) 15.310.8) 2640 (1598) 32.5 (1.597.a) 10664 1740 1660 2.463.3 1.223.4 5 898.5 8660 s 2,4638 5 959.6 $ 8852 1.066.55 1.5897 1.734.4 2.7883 Consolidated Statement of Shareholders' Equity Common stock Accumulated other Common stock in issued comprehensive income foss) treasury Additional Foreign Tora paid-in Retained Cash flow currency shareholders in millions, except per share data Shares Amount capital eamings Pensions hedges translation Shares Amount equity Balance at December 31, 2016 1,6606 $ 16.6 $ 6.7579 $ 46.222.7 $ (2071) $ 22.9 $ (2.908.7) (841.3) $ (52.108,6) $ (2.204.3) Net Income 5.192.3 5.192.3 Other comprehensive income (loss). net of tax 16.9 (394) 9370 914.5 Comprehensive income 6.1068 Common stock cash dividends ($3.83 per share) (3.089.21 (3.0892) Treasury stock purchases (314) (4.650.5) (4.650.5) Share-based compensation 117.5 117.5 Stock option exercises and other 1970 6.2 254.7 451.7 Balance at December 31, 2017 1,6606 16.6 7,0724 48,325.8 (190.2) (16.5) (1.9717) (866.5) (56,504.4) (3.268.0) Net income 5,924.3 5.9243 Other comprehensive income (loss). net of tax (26.4) 48.9 (453.6) (431.1) Comprehensive income 5.493.2 Adoption of ASC 606 (450.2) (450-2) Adoption of ASU 2016-16 (57,0) (570) Common stock cash dividends ($4.19 per share) (3.255,9) (3.255.9) Treasury stock purchases (322) (5.247.5) (5.247.5) Share-based compensation 1251 125.1 Stock option exercises and other 178,5 5.2 223.4 401.9 Balance at December 31, 2018 1.600.6 16.6 7.376.0 50.487.0 (216.6) 32.4 (2.425.3) (893.5 (61.528.5) (6.258.4) Net income 6,025.4 6,025.4 Other comprehensive income (los). net of tax (271) (204) 174.3 126.8 Comprehensive income 6,1522 Common stock cash dividends (34.73 per share) (3,581.9) (3.581.9) Treasury stock purchases (25.0) (4.980.5) (4.980.5) Share-based compensation 109.6 109.6 Stock option exercises and other 168.3 4.2 1804 348.7 Balance at December 31, 2019 1,660.6 $ 16.6 $ 7.6539 $ 52,930.5 $ (243.7) 5 120 $ 2.251.0) (9143) $ 166,328.6) 5 (8.210.3 (1) Accounting Standards Codification ("ASC") 606, "Revenue Recognition - Revenue from Contracts with Customers." (2) Accounting Standards Update ("ASU") 2016-16, "Income Taxes (Topic 740): Intra-Entity Transfers of Assets Other Than Inventory." See Notes to consolidated financial statements. You are all Equity Researchers for a financial services company in which I am a Portfolio Manager. Our firm is currently evaluating possible equity investments in a selected number of industries and I have organized you into teams to evaluate firms in each of these industries. Group 1: Beverage Group 6: Beverage Group 11: Beverage Group 16: Restaurant Group 2: Apparel Group 7: Apparel Group 12: Apparel Group 17: Technology Group 3: Restaurant Group 8: Restaurant Group 13: Restaurant Group 4: Technology Group 9: Technology Group 14: Beverage Group 5: Beverage Group 10: Beverage Group 15: Apparel For the industry your team is assigned, select both a base company and one similarly-sized competitor (peer). You must send both the name and the ticker symbol for both companies to me for my approval." Once approved, you must obtain the three most recent annual reports (Form 10-K) for both companies. Each team is required to perform analysis and provide a recommendation to me. You must make one of five recommendations: a strong buy for your base firm, a weak buy for your base firm, a strong buy for your peer firm, a weak buy for your peer form, or no buy (i.e., we should not invest in either firm). The analysis and recommendation must be written in the form of a business memorandum from the Equity Research team (you) to the Portfolio Manager (me) and must include each of the following components. In writing the memo, use section headers to clearly delineate each of the following five sections. 1. Analyze three items on the income statement (or income statement-based financial ratios; see the list on p. 3) for your base company for the last three years and discuss whether the company's performance related to these items appear to be improving, deteriorating, or remaining stable. Justify your answer. 2. Analyze three items on the balance sheet (or balance sheet-based financial ratios; see the list on p. 3) for your base company for the last three years and discuss whether the company's performance related to these items appear to be improving, deteriorating, or remaining stable. Justify your answer. 3. Identify the single largest adjustment (in absolute value) to reconcile net income to operating cash flow in the most recent year of your base company's statement of cash flows (contact me if they did not use the indirect method; also contact me if the identified item reflects something we haven't discussed in class before). Describe how and why the item arises - that is, broadly describe how it creates a disconnect between income and cash flows for your company. Then, assess the risk (low/medium/high) that this item adversely affects your base company's earnings quality in the most recent year. Justify your
Step by Step Solution
There are 3 Steps involved in it

Get step-by-step solutions from verified subject matter experts