Question: I need help with Question #6 Election analysis - The 2000 presidential election between Al Gore and George W. Bush was the closest presidential election
I need help with Question #6
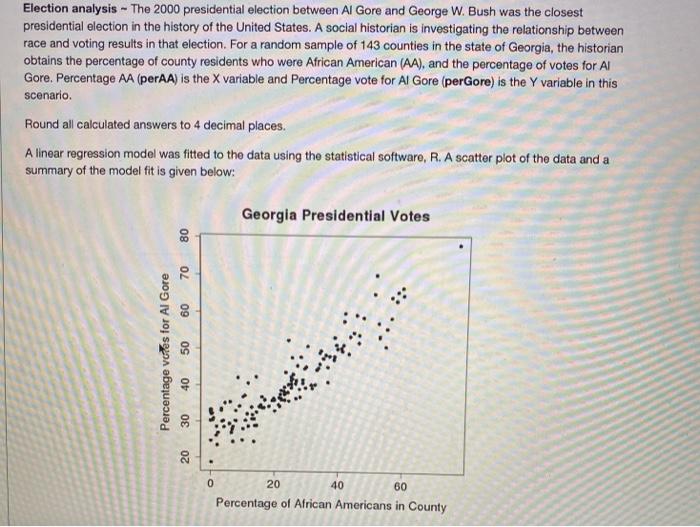
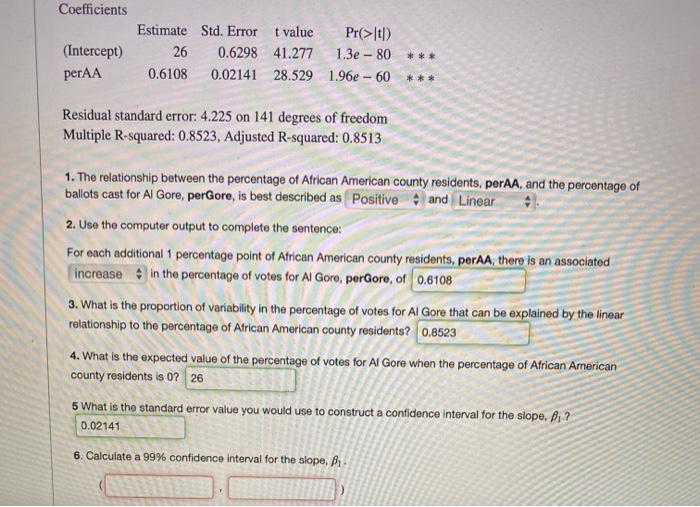
Election analysis - The 2000 presidential election between Al Gore and George W. Bush was the closest presidential election in the history of the United States. A social historian is investigating the relationship between race and voting results in that election. For a random sample of 143 counties in the state of Georgia, the historian obtains the percentage of county residents who were African American (AA), and the percentage of votes for Al Gore. Percentage AA (perAA) is the X variable and Percentage vote for Al Gore (perGore) is the Y variable in this scenario. Round all calculated answers to 4 decimal places. A linear regression model was fitted to the data using the statistical software, R. A scatter plot of the data and a summary of the model fit is given below: Georgia Presidential Votes 80 70 60 Percentage votes for Al Gore 40 OC 20 0 20 40 60 Percentage of African Americans in County Coefficients (Intercept) perAA Estimate Std. Error t value Pr(>It) 26 0.6298 41.277 1.3e - 80 *** 0.6108 0.02141 28.529 1.96e - 60 *** Residual standard error: 4.225 on 141 degrees of freedom Multiple R-squared: 0.8523, Adjusted R-squared: 0.8513 1. The relationship between the percentage of African American county residents, perAA, and the percentage of ballots cast for Al Gore, perGore, is best described as Positive and Linear 2. Use the computer output to complete the sentence: For each additional 1 percentage point of African American county residents, perAA, there is an associated increase in the percentage of votes for Al Goro, perGore, of 0.6108 3. What is the proportion of variability in the percentage of votes for Al Gore that can be explained by the linear relationship to the percentage of African American county residents? 0,8523 4. What is the expected value of the percentage of votes for Al Gore when the percentage of African American county residents is 0? 26 5 What is the standard error value you would use to construct a confidence interval for the slope, B.? 0.02141 6. Calculate a 99% confidence interval for the slope, Election analysis - The 2000 presidential election between Al Gore and George W. Bush was the closest presidential election in the history of the United States. A social historian is investigating the relationship between race and voting results in that election. For a random sample of 143 counties in the state of Georgia, the historian obtains the percentage of county residents who were African American (AA), and the percentage of votes for Al Gore. Percentage AA (perAA) is the X variable and Percentage vote for Al Gore (perGore) is the Y variable in this scenario. Round all calculated answers to 4 decimal places. A linear regression model was fitted to the data using the statistical software, R. A scatter plot of the data and a summary of the model fit is given below: Georgia Presidential Votes 80 70 60 Percentage votes for Al Gore 40 OC 20 0 20 40 60 Percentage of African Americans in County Coefficients (Intercept) perAA Estimate Std. Error t value Pr(>It) 26 0.6298 41.277 1.3e - 80 *** 0.6108 0.02141 28.529 1.96e - 60 *** Residual standard error: 4.225 on 141 degrees of freedom Multiple R-squared: 0.8523, Adjusted R-squared: 0.8513 1. The relationship between the percentage of African American county residents, perAA, and the percentage of ballots cast for Al Gore, perGore, is best described as Positive and Linear 2. Use the computer output to complete the sentence: For each additional 1 percentage point of African American county residents, perAA, there is an associated increase in the percentage of votes for Al Goro, perGore, of 0.6108 3. What is the proportion of variability in the percentage of votes for Al Gore that can be explained by the linear relationship to the percentage of African American county residents? 0,8523 4. What is the expected value of the percentage of votes for Al Gore when the percentage of African American county residents is 0? 26 5 What is the standard error value you would use to construct a confidence interval for the slope, B.? 0.02141 6. Calculate a 99% confidence interval for the slope